Hello friends! Welcome to Market Sentiment. Join 14,165 other smart investors and traders by subscribing here:
You can check out my best articles here and follow me on Twitter too!
This issue of Market Sentiment is brought to you by… Masterworks
Bitcoin Takes off Again, but Will the Rally Last?
Bitcoin is back! After plunging in November, Bitcoin finally broke through a key resistance level and hit $48,234 last week. But there’s a problem.
Many analysts agree the coin may take another dip soon… Prompting a number of crypto millionaires to move their money into a safer alternative asset.
I’m not talking about investing in stable coins, farmland, or Llama JPEGs, I’m talking about fine art. Most experts are only just beginning to understand art’s real financial power. In fact, 85% of wealth managers want to include art in their wealth management offerings.
Here’s a few reasons why:
Contemporary art prices outpaced S&P returns by 164% (1995–2021).
Deloitte predicts the global value of art to grow by $1 trillion (with a T) by 2026.
Nearly 0 correlation to developed equities according to Citi
And there’s only one app that lets you invest in this amazing asset class. Now, you can invest in real, one-of-a-kind masterpieces — without needing a hedge fund guru-sized bank account.
Since 2017, they’ve sold three offerings and got their investors a net annualized gain of over +30%. This isn’t an indication of overall performance, but impressive if you ask me.
Want in?
*See Important Reg A disclosures
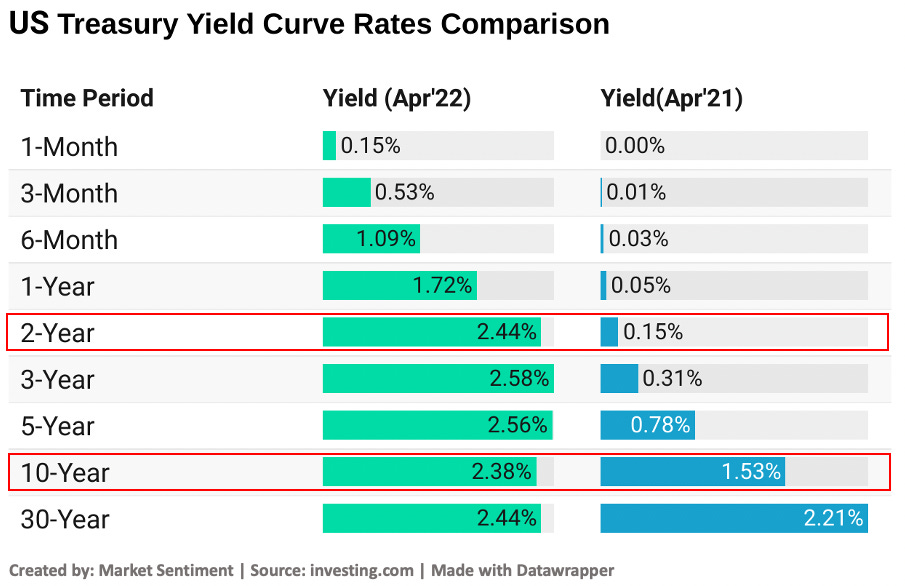
Finally, the yield curve has inverted. It’s something we were all expecting to happen ever since the Fed announced its rate hikes last month. The two-year yield settled in at 2.430% compared to the 2.374% yield of the 10-year U.S Treasury note last Thursday. This is the first time the two-year yield closed above the 10-year yield since 2019. Adding to this, the spread between 5-year and 30-year bonds inverted for the first time since 2006! An inverted yield curve is a very prominent indicator for predicting an upcoming recession.
But, before we jump into the implications of the yield curve inversion, it’s important to understand what a yield curve is, how it predicts a recession, and what the previous data tells us.
What is the Yield Curve?
The yield curve is just a graph showing the relationship between the short-term and long-term interest rates of the U.S Treasury bond. The bond here is the promise between you and the U.S govt that says if you loan some money now (by buying the bond), they will give it back to you later with an added interest.
The above chart shows how a normal yield curve would look. The simple logic here is that it’s riskier for you to buy a longer-term bond (the future is uncertain because of all the unknowns, good and bad, that could happen over years of time) and you are rewarded proportionally for taking the larger risk. For eg., you would get a significantly lower interest rate if you are investing for 1-year vs 20-year as it’s generally riskier to stash away your money for a longer time period.
But the yield curve is not always positive. If the long-term and the short-term rates get closer together, the yield curve become flat. Finally, if the short-term rates are higher than the long-term rates, the yield curve becomes inverted.
The yield curve becomes inverted when a lot of people are worried about the short-term economy. In theory, you would demand a higher return for taking on a higher risk. So if the yield rate for a short-term bond is higher than a longer-term bond, it implies that investors are so worried about the short-term economic outlook (i.e they think the present is much riskier than the future) that they are willing to invest in a longer-term bond at a lower rate.
Where does the yield curve stand now?
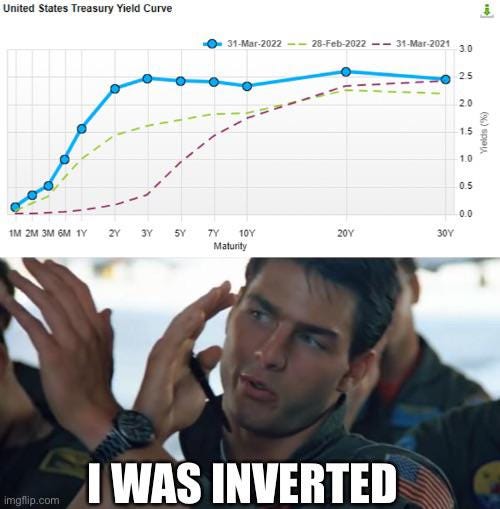
This excellent visualization by Eeagli shows how the yield curve has changed over the past 6 months. The yield curve hasn’t completely inverted yet, but still, it’s a cause for concern.
The drastic difference that occurred in just the last year in the yield rates is visible in the above chart! Ideally, the yield rates are supposed to be in increasing order like it was in Apr 2021. Now the 2-year yield rate is more than the 10-year one and almost equal to the 30-year yield rate.
Does Yield Curve Inversion Predict a Recession?
The yield curve is considered one of the best signals that are currently available for predicting a recession. As per the research done by FRBSF,
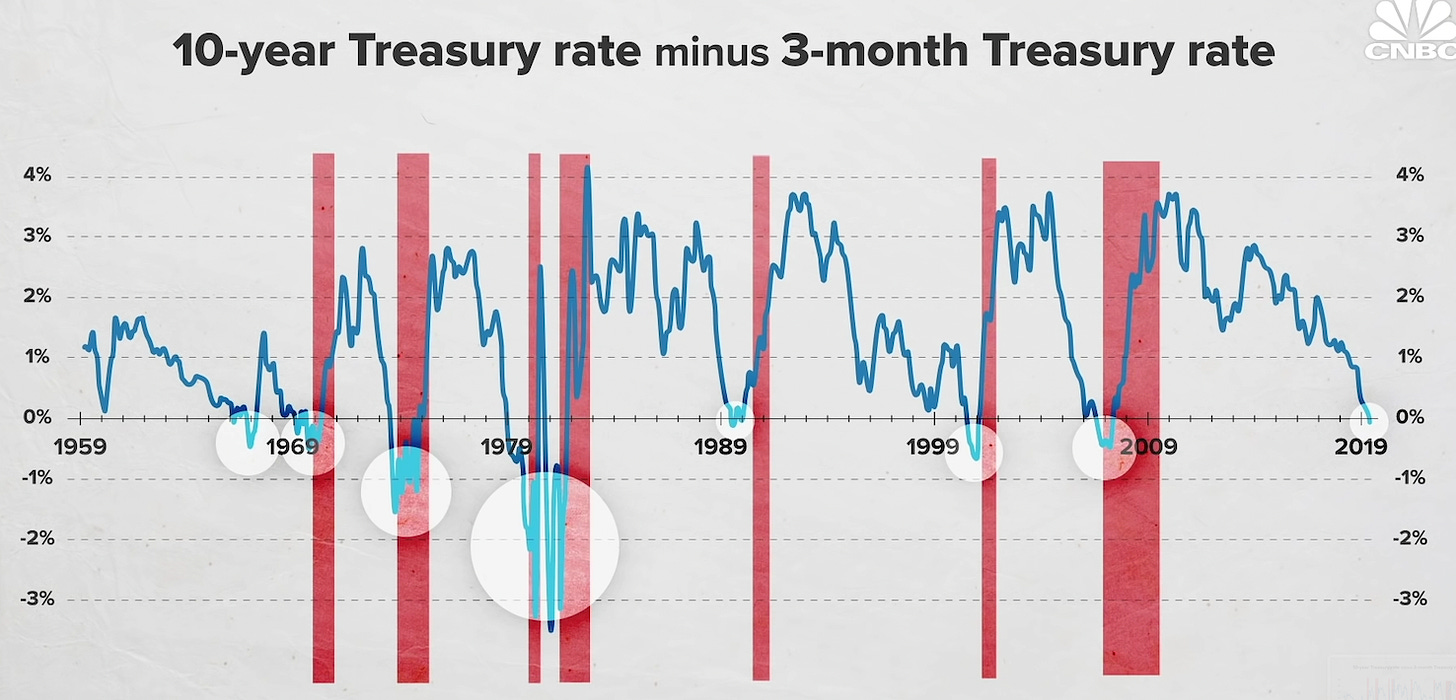
Every U.S. recession in the past 60 years was preceded by a negative term spread, that is, an inverted yield curve. Furthermore, a negative term spread was always followed by an economic slowdown and, except for one time, by a recession. - FRBSF

While the above results are for the spread between 1 and 10-year rates (which is still positive now), research done on 2-year and 10-year spreads shows a similar trend. According to Commonwealth Financial Network, the 10-and-2 yield curve has inverted 28 times since 1900, and in 22 of those instances, a recession has followed.
While there is certainly statistical merit for yield curve in predicting a recession, where experts are conflicted is in the type of spread that should be used. There are various different spreads we can consider (3-month vs 10-year, 1-year vs 10-year, 2-year vs 10-year, etc.). All of these provide different probabilities and timelines for an upcoming recession. For example, if you consider the 3-month vs 10-year spread (positive as of now), it has predicted every recession with 100% accuracy in the last 50 years.
What’s the best thing to do now?
Given that, an inverted yield curve is a reliable indicator of a looming economic downturn, what should we do to best prepare our portfolios incase a recession hits. The worst thing you can do now is to panic - especially when the yield curve inverts.
The problem is that even though yield curve inversion indicates a recession, it does so long before the actual recession hits. For eg, the tech bubble burst in Mar’01 but the yield curve had inverted almost 3 years before that (34 months to be exact). The same thing occurred again during the 2008 financial crisis when the yield curve inverted as early as 2005.
According to research conducted by LPL Financial, Yield curve inversion can be bullish for stocks, and the last four times the 2-and-10 yield curve inverted, the S&P 500 was up an average of 28.8% before it peaked!
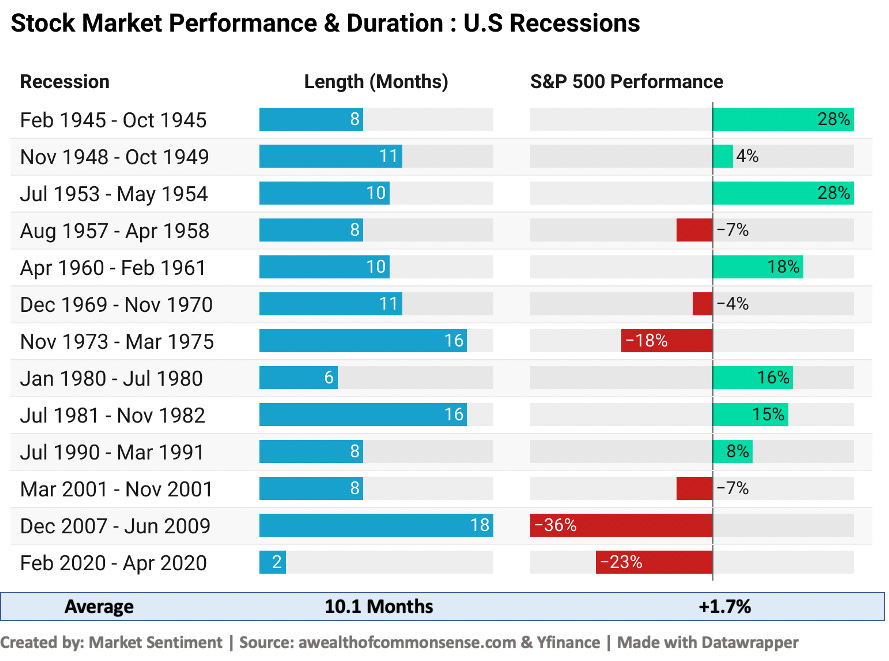
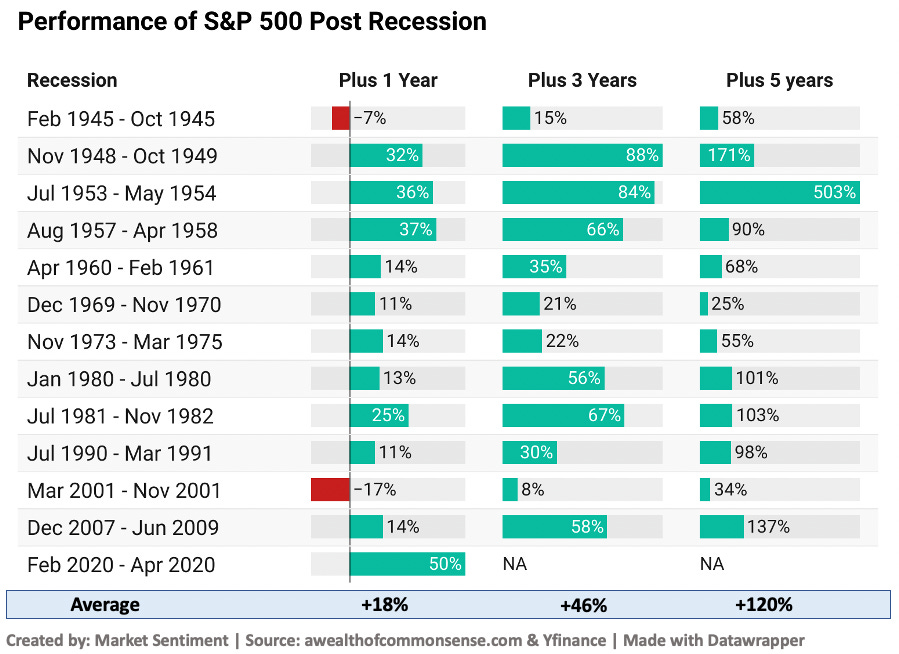
Adding to this, I had done an extensive analysis of how the stock market performs during and following a recession.
On average, the U.S recessions lasted only 10 months and the market returned a +1.7% in return. What is even more interesting is the market performance just following the recession.
After the end of the recession, in just one year, you would have made money in 85% of the cases. And after 3 years, you would have been in the green in 100% of the cases!
Conclusion
Predicting future economic developments is a tricky business! There are 100’s of factors that are different than the last time, but an inverted yield curve is one of the most reliable predictors we have for accurately predicting a recession.
But as we could see from the analysis, it takes a while for the economy to finally go into recession after the curve has been inverted and you will miss out on the gains till then if you stay out of the market. If you are feeling truly adventurous, you can always try keeping a certain portion of your portfolio out and try to buy the inevitable dip.
For the rest of us, even if the recession hits, the best strategy is to stay invested and weather the storm.
until next week…








Like you said in the article the average recovery time to put yourself in the green after a crash is about three years. So for a buy and hold investor (one that doesn't use leverage) that's pretty quick turnaround in the grand scheme of things. I think the one thing that would be more worrying than that is a long period of stagflation or near zero real growth. There was a post in r/fluentinfinance that got crossposted to r/marketsentiment on reddit here:
https://www.reddit.com/r/FluentInFinance/comments/twb7ts/two_decades_of_zero_returns3_different_times/?utm_source=share&utm_medium=web2x&context=3
where it showed that the market has historically had long periods of no growth followed by strong bull markets. In a case where that happens to the stock market for the next decade or so I would think that following a put writing index would be the best option because it would generate premiums/returns even in flat markets. This paper shows that a put writing index outperforms during both bear markets and down markets:
https://citeseerx.ist.psu.edu/viewdoc/download?doi=10.1.1.458.4882&rep=rep1&type=pdf
One of the more recent articles I wrote did not directly touch on this aspect of using option writing to generate returns during flat markets, but it did show that selling options on leveraged indexes statistically is about as risky as selling options on an unleveraged index given you sell them far enough OTM.
https://premiumincomeinvestments.substack.com/p/leveraged-income-generation?r=1awcwu&s=w&utm_campaign=post&utm_medium=web