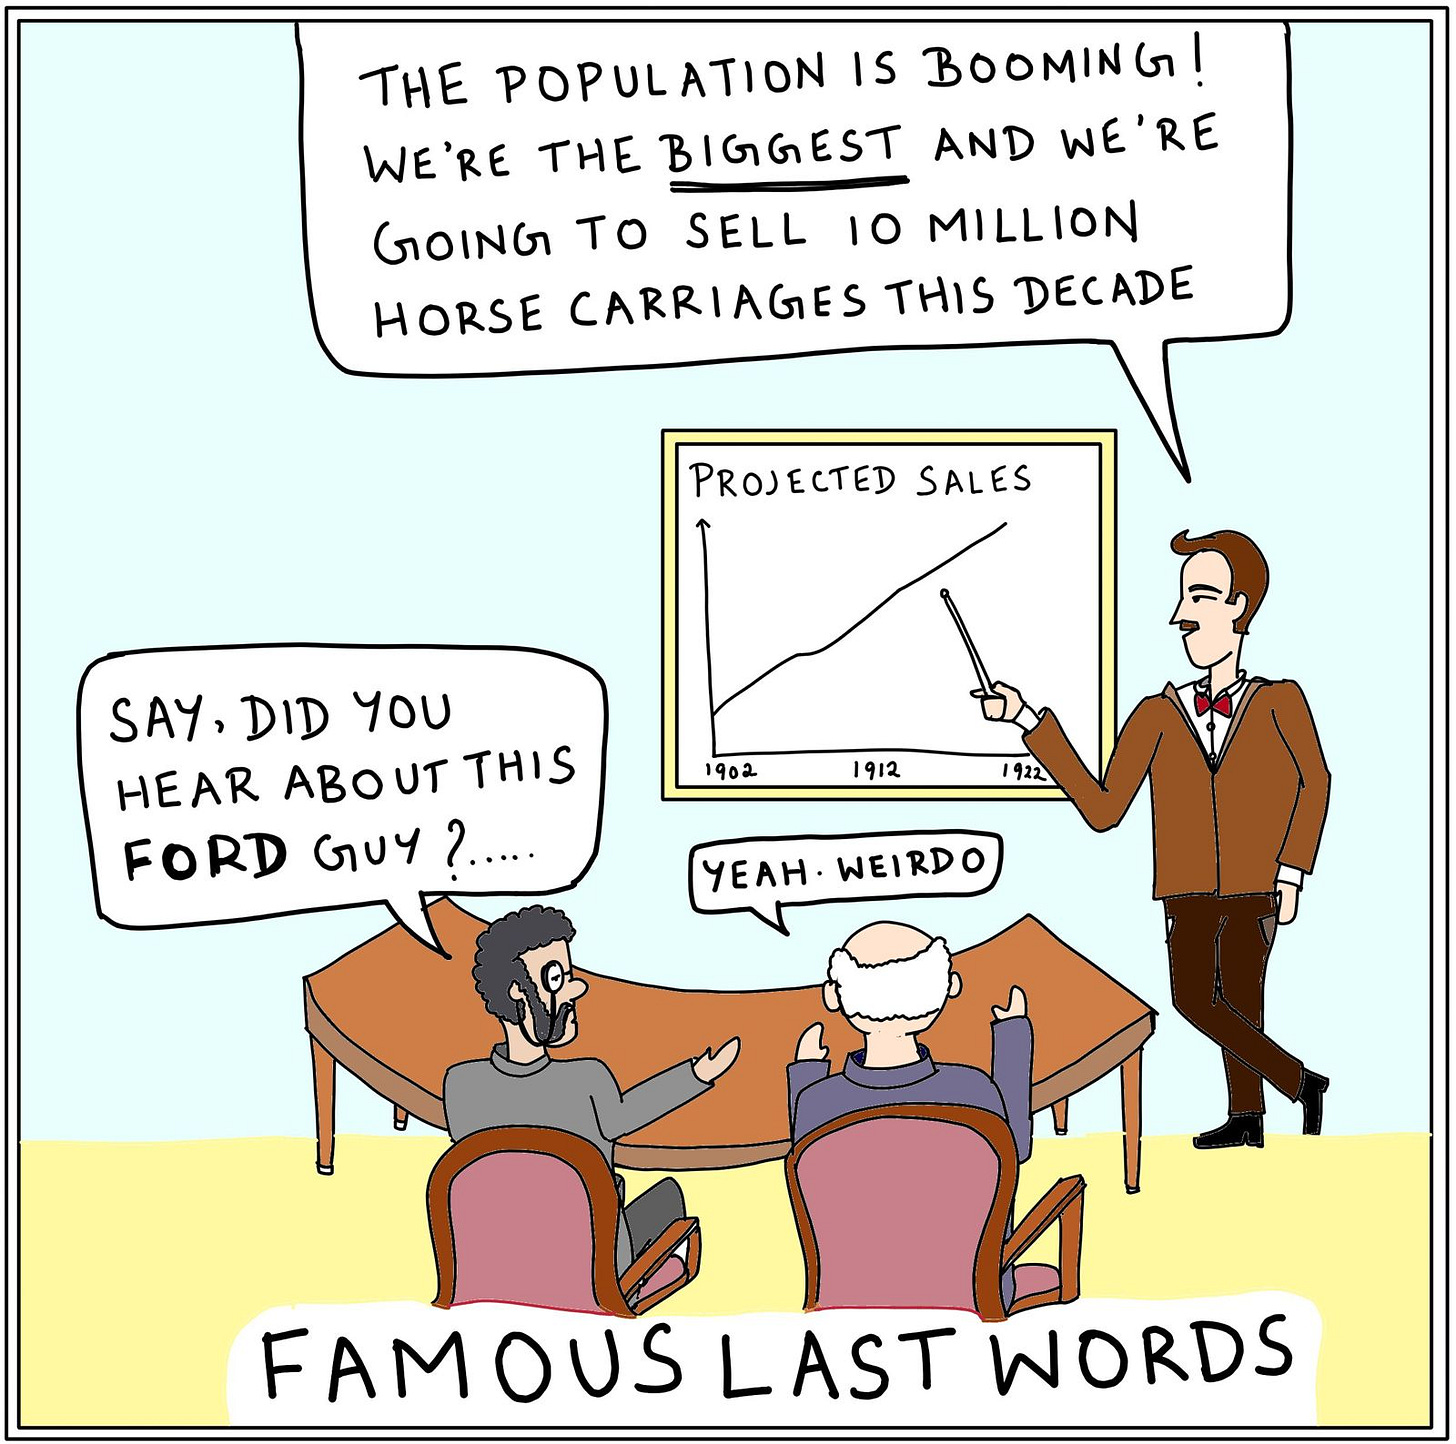
Should you invest in the biggest companies?
Forewarned is forearmed.
Trees don't grow to the sky — German Proverb
In the heart of California's Redwood National Park, Hyperion, the tallest tree on Earth, stands as a natural wonder. Towering at 380 feet, this coast redwood has grown for centuries, weathering storms, fires, and the changing climate. Yet, even Hyperion, with its monumental height, will not grow forever.
When it was young, Hyperion could grow up to 10 feet per year under the right conditions. However, after more than 700 years, the tree now barely grows at 1.5 inches per year. The most common explanation for this decreasing growth rate is gravity. As trees grow taller, they must work harder to overcome gravity, pushing water and nutrients all the way to the top. Additionally, they face structural limitations in supporting their weight and increased wind exposure. Eventually, all trees reach an equilibrium.
Everything has a natural limit to growth. This concept is evident everywhere if you look around.
It is an elementary principle of aeronautics that the minimum speed needed to keep an aeroplane of a given shape in the air varies as the square root of its length. If its linear dimensions are increased four times, it must fly twice as fast.
Now, the power needed for the minimum speed increases more rapidly than the weight of the machine. So the larger aeroplane, which weighs sixty-four times as much as the smaller, needs one hundred and twenty-eight times its horsepower to keep up. — J. B. S. Haldane
Yet, most investors tend to forget this when they invest.
While the biggest companies occupy most of the news and investor interest, rarely do they provide the best returns.
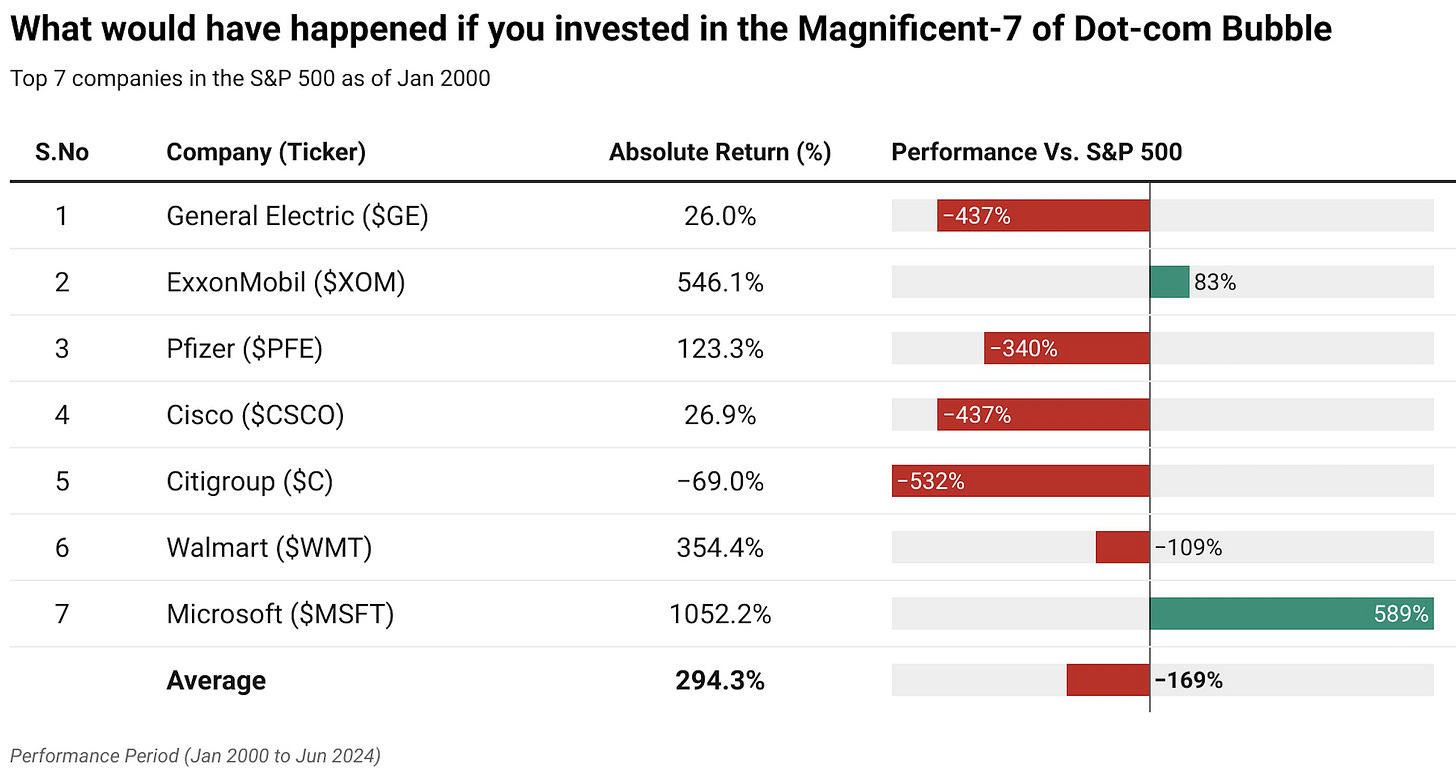
Magnificent-7 of the dot-com bubble
The dot-com bubble was one of the most recent bubbles where the introduction of a new technology led to speculation and massive overvaluation in the market. So what would have happened if we had invested in the Magnificent-7 of the dot-com bubble?
Even though many of the top 7 companies did not share the speculative characteristics of the companies that drove the mania, investing in them was still a losing proposition. 5 out of the 7 companies underperformed the market, with Citi still down 69% after 25 years! On average, an equal-weighted portfolio of the top 7 companies from ‘99 underperformed the market by a wide margin (even after accounting for Microsoft's stellar performance!)
The performance of the leading tech stocks was even worse. Not even 1 out of the top 10 largest market-cap tech stocks beat the S&P 500 over the next 18 years.
At the beginning of 2000, the 10 largest market-cap tech stocks in the United States, collectively representing a 25% share of the S&P 500 Index—Microsoft, Cisco, Intel, IBM, AOL, Oracle, Dell, Sun, Qualcomm, and HP—did not live up to the excessively optimistic expectations.
Over the next 18 years, not a single one beat the market: five produced positive returns, averaging 3.2% a year compounded, far lower than the market return, and two failed outright. Of the five that produced negative returns, the average outcome was a loss of 7.2% a year, or 12.6% a year less than the S&P 500. — Research Affiliates.
How long can you be #1?
The fundamental problem with becoming the most valuable company in the world is that you will have a big target painted on your back. Competitors will consider you their biggest headache, customers will think you are price gouging, and Congress will accuse you of being a monopoly. Case in point — Just as Nvidia became the world’s most valuable company, it started to face antimonopoly probes from the US Justice Department and Federal Trade Commission.
All this to say that, over and above the obvious problem of growing a very large base, the biggest companies face a plethora of additional issues that smaller companies do not.
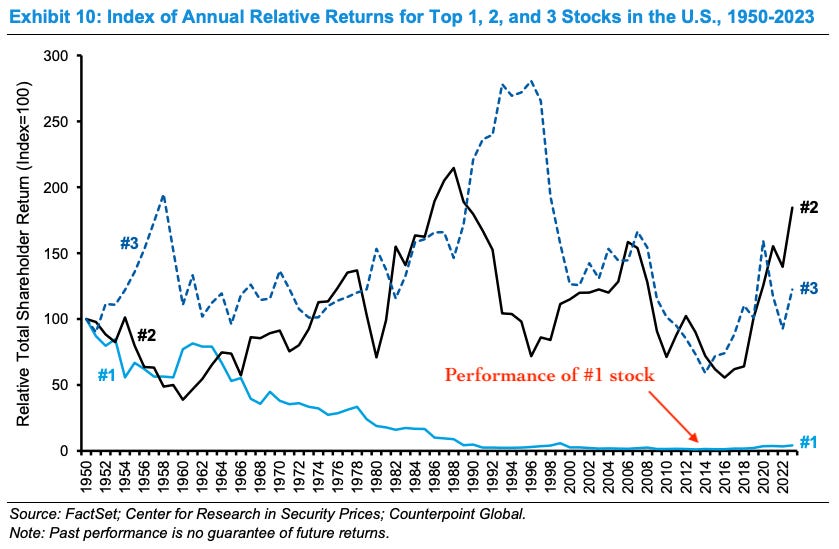
Data proves the same — Investing in the #1 stock almost always underperformed the market.
First, the top stock has historically been a bad investment. Specifically, the arithmetic average of the series of annual returns of the top stock relative to the S&P 500 from 1950 to 2023 was -1.9 percent. The geometric return of the series was -4.3 percent, reflecting the fact that the series was volatile. — Morgan Stanley Insights
Ned Davis Research also had similar findings that showed that from 1972 to 2013, the S&P 500 was up close to 5,000%, but if you had owned just the biggest stock in the index every year, you would have only gained around 400%.
But as investors, we rarely put everything into one company. The final piece of the puzzle is how a portfolio of these biggest stocks performs compared to the market — If history is any guide, investing in the largest stocks is a surefire way to increase portfolio risk and underperform the market.
Let’s dig in:


