Shannon's Demon
The most important investing idea you've never heard of
Claude Shannon was an extraordinarily gifted scientist and engineer. He almost single-handedly invented information theory — The science of communication that made modern computers, digital media, and the internet possible. It was Shannon’s idea that the computers should communicate using 0’s and 1’s.
Shannon was not just a scientist though — He was also a successful investor. When Barron reported the performance of 1,026 mutual funds in 1986, Shannon had achieved a higher return than 1,025 of them!
When Warren Buffett bought Berkshire Hathaway in 1965, it was trading at $18 a share. By 1995, each share was worth $24,000. Over thirty years, that represents a return of 27 percent. From the late 1950s through 1986, Shannon’s return on his stock portfolio was about 28 percent. — Excerpt From Fortune’s Formula
It was during one of his historic lectures at MIT in the 1960s that he posed an exercise now known as Shannon’s Demon.
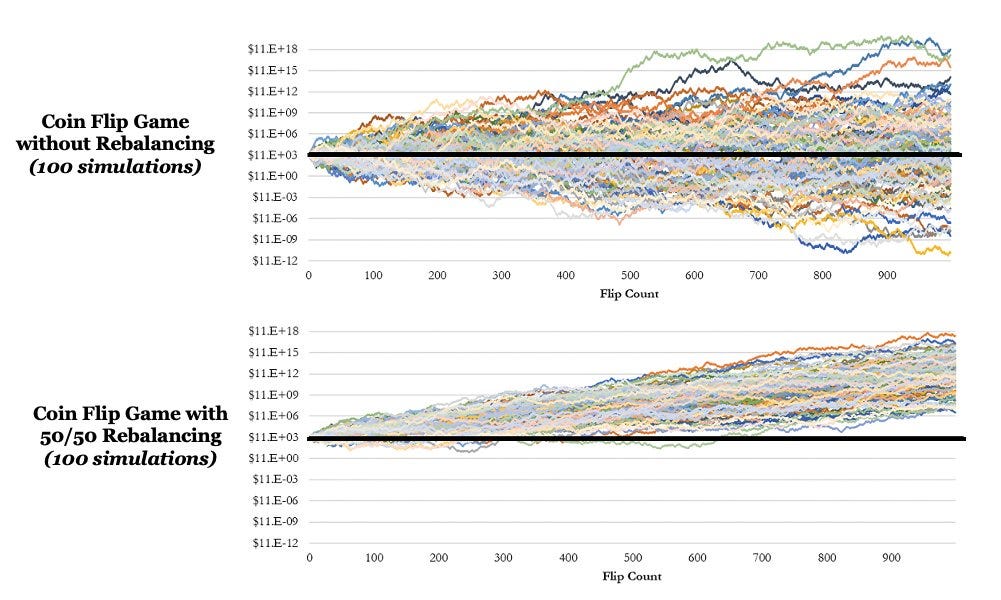
Consider a simple coin flip game to simulate an asset with zero long-term returns. If it’s heads, you win 50% of your bet amount; if it’s tails, you lose 33.3%. Even though the arithmetic return is positive, this game has a long-term expected return of zero.
Arithmetic Return => (0.5 × 50%) + (0.5 × −33.3%) = 8.35%
Geometric Return=((1 + 0.5) × (1 − 0.333))^0.5 − 1 = 0
At first glance, there is no way to win long-term from this game if we are using a fair coin. We will just broadly oscillate around the original portfolio. But Shannon showed us that we can completely change this outcome by making a simple change.
Instead of betting all of your portfolio on every bet, rebalance 50% into cash after each flip regardless of whether you win or lose.
Intuitively, this should not make any difference, as cash has zero expected return. But, in reality, the CAGR is now positive.
Quick side note — For those who are curious, even if the coin flip is not evenly switching between heads and tails, we get similar results.
To understand what’s happening, we must recognize the impact of volatility drag. The compounded average growth rate of an investment can be approximated as
CAGR ≈ AVG − (SD²/2)
AVG is the average return and SD is the standard deviation (aka volatility)
Straightaway we can observe that volatility has a bigger role to play in the long-term compounding. When we bet the full amount each time, our average return is higher (~8.4%), but our portfolio volatility is also higher (0.42). Plugging into the above formula gives us a CAGR of zero.
CAGR = 0.084 – (0.421² / 2) ≈ 0%
By moving 50% of our portfolio to cash, we reduce the average expected return to 4.1%, but the volatility is also cut down to 0.21 instead of 0.42. So, in the new portfolio, the updated CAGR is
CAGR = 0.042 – (0.21² / 2) ≈ 2%
This 2% is the edge Shannon's Demon creates.
While this might look like a purely academic thought experiment, the result has massive real-world implications. Using this we can evaluate
Rebalanced portfolio vs. Buy and hold portfolio
Why Warren Buffet’s buy & hold strategy works
How a combination of two losing strategies can become a winning one
Practical applications of Shannon’s Demon (and how a portfolio with stocks and gold outperformed a 100% stocks portfolio)
Let’s dig in:


