Next decade for U.S. equities
What will it take to have a repeat of the past decade?
During the peak of the dot-com bubble in Sep’99, MIT professor Peter A Diamond published a report1 on what stock returns we can expect for the coming few decades. The idea behind the report was to address the concerns regarding the assumption of a 7% real return for stocks over the long term (75-year projection) by the Social Security office.
The critics of the 7% return assumption had solid arguments:
The valuations for stocks were very high relative to benchmarks in 1999, which reduced future returns.
Reduced cost of stock investing had led to broad stock ownership.
Projected slower economic growth in the future (1.5%).
In his report, Diamond concluded that the 7% expected return assumption was inconsistent with the then (in ’99) stock market valuation and the slow projected GDP growth rate.
Given the high value of today’s stock market and an expectation of slower economic growth in the future, the Social Security Office could adjust its stock return projections in one of two ways.
(1) It could assume a decline in the stock market sometime over the next decade, followed by a 7.0 percent return for the remainder of the projection period (75-year).
(2) adopt a lower rate of return for the entire 75-year period. — Peter Diamond
At the end of 2023, the critics' and the report's conclusions hold true. Even though $10K invested in the S&P 500 in 2000 would have grown to over $60K, adjusted for inflation, the stock market only returned 4.79%2 (real return) in the past two decades vs the expected return of 7%.
Now that we are at the crossroads between the AI hype and historically high inflation and stock valuations, it’s interesting to see what it will take to have a repeat of the past decade of U.S. stock market performance.
2013 to 2023 — An exceptional decade for the U.S. market
Even accounting for the Covid crash, the S&P 500 outperformed cash by 11.9% annually from 2013 to 2023 (Q3). This is well above the 90th percentile of the rolling 10-year performance across global developed equity markets (since 1950)3.
This exceptional performance has led to many investors asking whether the ideal investment strategy is to invest 100% into the S&P 500.
While the quick answer is no for most investors, for a more nuanced discussion, we have to break down the S&P 500 returns into its components. This will help us better understand the underlying factors that drove the returns and, more importantly, what it would take for U.S. equities to continue their outperformance.
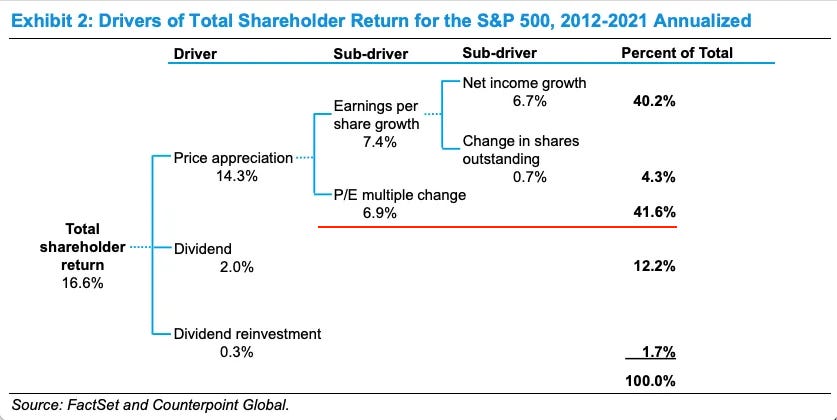
We can start by leveraging this excellent report from Morgan Stanley, where Michael Mauboussin broke down the various drivers of total shareholder return for the S&P 500 from 2012 to 2021.
A concerning trend that we can immediately recognize is that P/E multiple expansion (i.e., the stock price rising faster than the underlying earnings) drove a significant proportion (41.6%) of the returns.
AQR research went one step further and compared the past ten years' data with long-term historical trends, and the insights were striking.
The majority of returns of the past decade were driven by
Real earnings growth — Earnings growth contributed 4.5% of the 11.9% return4 of the S&P 500. This growth was extremely strong relative to history and was due to the lowering of the effective tax rate and decline in financing costs (near-zero interest rates)5
Richening Valuation — The Shiller PE ratio for the S&P 500 has consistently increased over the last decade, and this multiple expansion contributed an additional 3.6% to the S&P 500 returns. This is worrisome as winning simply because the other person is willing to pay more is not a sustainable strategy.
The beauty of this breakdown is that once we understand the individual components driving the returns, it's much easier to predict and see what assumptions and conditions are required for a repeat performance.


