


Monte Carlo Retirement
All the ways that your retirement can play out

Never cross a river if it is on average four feet deep. – Nassim Taleb
Averages can be deceiving. Consider a group of 100 gamblers who go to a casino on a given night with $100. They play throughout the night, betting their money on different games. Some lose, some win, and a handful lose everything. Let’s say only 5 out of 100 were ruined. Then the probability of ruin can be assumed as 5%, which doesn’t seem so bad. But the participants have no connection here – when the 16th gambler goes broke, the 17th isn’t affected.
Now consider a second situation where the same gambler goes to the casino for 100 days in a row, starting with a fixed amount. On some days he’s lucky, on other days, not so much. If he loses all his money on day 40, there is no day 41. He reaches ruin, which prevents him from playing any further. No matter how skilled the gambler is, if he plays a risky game, there is a 100% probability that he will go bust within 100 days.
The difference is that the first situation is an ensemble average which looks at the performance of a group at one point in time, while the second case is a time average that looks at an individual’s performance over a period of time. If you’re an investor in the market, your time average can be quite different from the ensemble average, but you need to optimize your individual performance in the long run.
One way is to look at a Monte Carlo simulation. This is a study of not just outcomes but also paths – it starts with a situation and analyzes all the ways in which the future can unfold. Studying these paths can give us a better idea of the range of outcomes than a simple average.

For example, if you start in the market with a portfolio, the Monte Carlo simulation can slightly change:
The annual stock returns
The inflation rate
The bond yield
Even slight variations add up to create a range of outcomes. A Monte Carlo simulation is a useful tool for analyzing your retirement portfolio. It can help answer:
If you withdraw a fixed amount every year and have no income, will your portfolio run out of money at some point?
What happens when you change your asset allocation?
How will your portfolio perform if there is a streak of bad years?
How do you maximize your odds of survival and success?
How much to withdraw?
Americans’ average net worth at retirement is about $1.5 to 1.6 million, in the age bracket of around 55 to 65. According to the Bureau of Labor Statistics, the average American spends about $52,000 in retirement. Let’s assume you start with a portfolio of $1 million at age 60 and chart the portfolio performance for the next 30 years. We considered 5 different portfolios:
100% stocks
75% stocks, 25% bonds
50% in stocks and bonds
25% in bonds, 75% in stocks
100% bonds
The stocks here are the S&P 500 and the bonds are intermediate term treasury bills. Assuming a fixed withdrawal of $50,000 every year, this is how the Monte Carlo Simulation would play out for a 100% stock portfolio. The simulation tests out 5,000 portfolios with slightly different parameters at each stage:
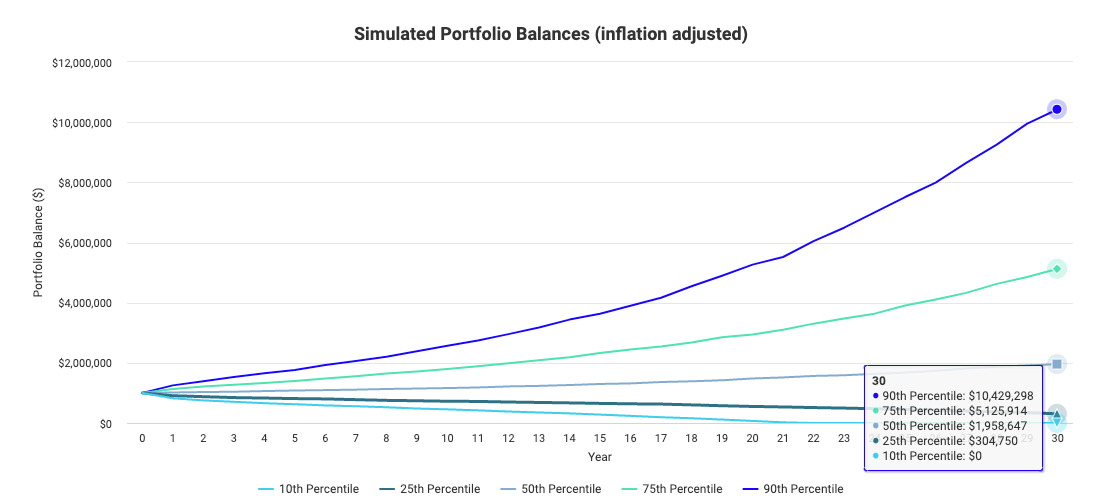
The top 25% of investors do extremely well when they go all-in on stocks, with a net worth of $5 to $10.5 million after 30 years. But 25% of investors have a net worth of less than $300k, and 10% of investors go broke. Further, we can also understand the safe withdrawal rate for investors in different percentiles.
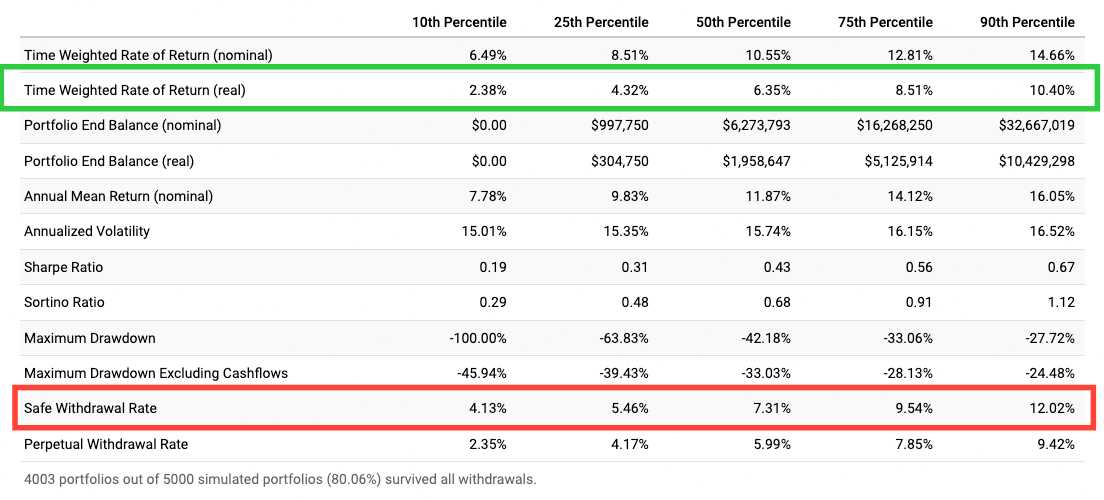
The bottom 10% could have avoided ruin by withdrawing only 4% of their portfolio yearly, while the top 10% could have safely withdrawn up to 12%. However, both groups had an identical portfolio and only the external conditions were different.
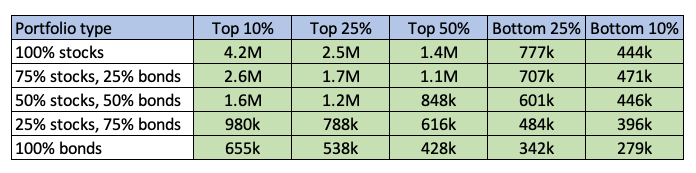
We can perform a similar analysis for the other stock-bond portfolios (all figures in inflation-adjusted dollars):
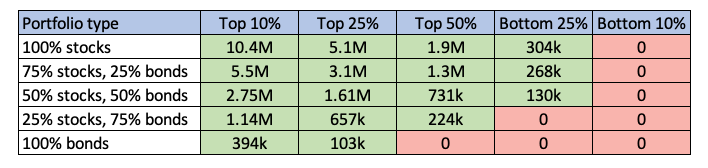
The portfolios that perform the worst across all given scenarios are the ones that have a high proportion of bonds. While bonds can lend some stability to a portfolio against drawdowns and market fluctuations, their yield wouldn’t match the withdrawal rate in the long term.
A more practical approach is to withdraw a percentage of the invested assets as annual income instead of a fixed amount every year. This has the advantage that you will never run out of money, but your annual withdrawal might also vary widely depending on the market or bond performance. For the 100% stock portfolio with a withdrawal rate of 5%, this would be the range of outcomes:
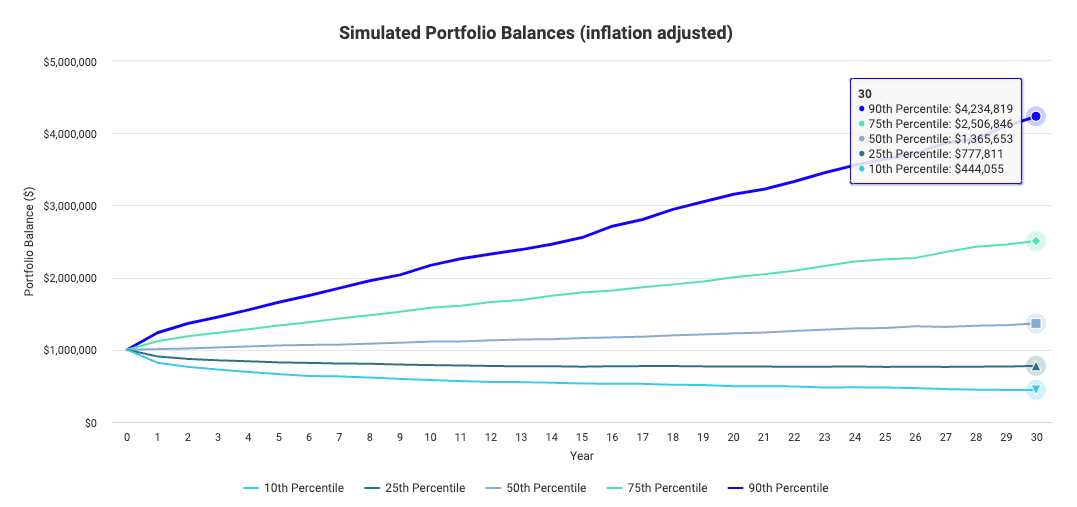
The variation in the top and bottom percentiles is much lesser in this case. This is how different portfolios would perform with a percentage withdrawal strategy:
Adding bonds to your portfolio seems to reduce the potential upside – but that’s the point. After retirement, most people try to minimize the downside rather than aiming for higher returns, and weighting towards bonds can protect them from the volatility of the market. Even for bottom 10% of performers, there is still a respectable amount remaining in their portfolio regardless of the allocation strategy, and the bond-heavy portfolios could preserve these returns even during bear markets.
The analysis so far might give the impression that going all-in into stocks or weighting towards stocks during retirement gives the highest returns, but the Monte Carlo simulation has some limitations:
It assumes that years with good and bad returns are randomly distributed.
It underestimates the impact of stock market drawdowns.
But stock market returns and bond yields are not always random – both bear markets and bull markets can persist for long periods when they begin. What happens if the worst 5 or 10 years of returns happen just after you retire?