Hey! It’s just been one week since we opened our paywall and the support has been overwhelming. Thank you so much to all those who subscribed. This would be the last free issue of Market Sentiment – If you have enjoyed the 100+ analyses we have created over the past 2 years, please consider upgrading your subscription.
Magicians are the most honest people in the world. They tell you they’re gonna fool you, and then they do it – James Randi
Jason Zweig, author of Your Money and Your Brain and editor of Benjamin Graham’s The Intelligent Investor highlighted three ways to make money:
1) Lie to people who want to be lied to, and you’ll get rich.
2) Tell the truth to those who want the truth, and you’ll make a living.
3) Tell the truth to those who want to be lied to and you’ll go broke.
There is a massive audience for No.1 and that’s what you see with the “Top 10 tech stocks to buy now” or “Secret stock picks of billionaires” posts popping up every day on your feeds. People want to believe in the impossible – that they will be able to beat the market by following a financial guru or that riches are just one stock pick away.
During the war in Yugoslavia, two professions were in high demand: soldiers and fortune-tellers. Given that we might be moving into another tough year for the stock market with high inflation, a looming recession, and ever-increasing interest rates, investors will be looking towards these “experts” more than ever to tide them over the rough times. Don’t believe us? Right now, there are more than 1 million paid subscribers to Motley Fools’ stock advisory service and ~20 Million monthly visitors to Jim Cramer’s TheStreet website.
There is an endless supply of stock pickers out there and Jim Cramer is arguably the most famous one! So, it’s only fair that we put his stock picks to the test. In fact, our very first analysis was on Jim Cramer and from then on it’s been our tradition to start off the year by evaluating his performance1 .
1-day performance of Cramer’s recommendations is excellent! On average, the Buy and Positive mention stocks went up by 0.03 and 0.05% respectively, and sell and negative mention stocks went down by 0.1 and 0.02%. Another interesting fact is that you would not have lost money if you had followed Cramer’s Buy recommendations. - Jim Cramer Performance (2016 to 2021)
But, it’s often said that everyone is a genius in a bull market – 2022 was anything but an easy year for equities. Let’s dig into how Cramer performed in 2022!
Jack of all trades
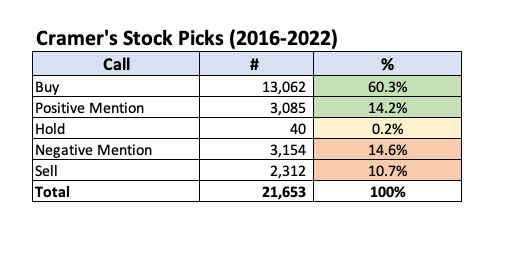
An equity research analyst usually covers at most 10-15 companies annually and issues directional calls every quarter. But, Cramer has made an incredible 21,653 stock picks2 over the past 7 years averaging close to 3,000 calls per year. He was making more than 20 stock picks per episode of his show. We can clearly see the classic bullish bias on the calls made by Cramer with 74% of the picks in the buy/positive mention.
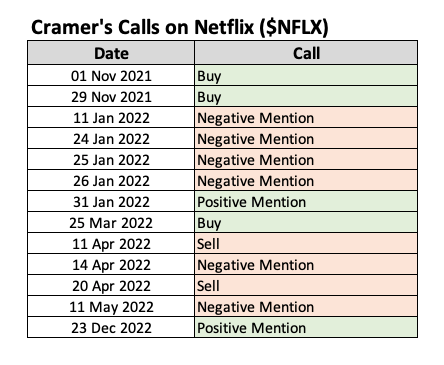
One concerning behavior exhibited by Cramer is how frequently he changes his mind. Consider the case of Netflix. He ended 2021 by stating Netflix is a buy but then changed his tune after just a month. Once again in March, he said that it was a buy and then changed it to a sell rating just 2 weeks later. Consistently following his calls would be a nightmare for even the most seasoned stock trader!
Since Cramer frequently contradicts his own picks, we are only evaluating the short-term performance (up to a month) of his calls3.
Cramer’s Performance
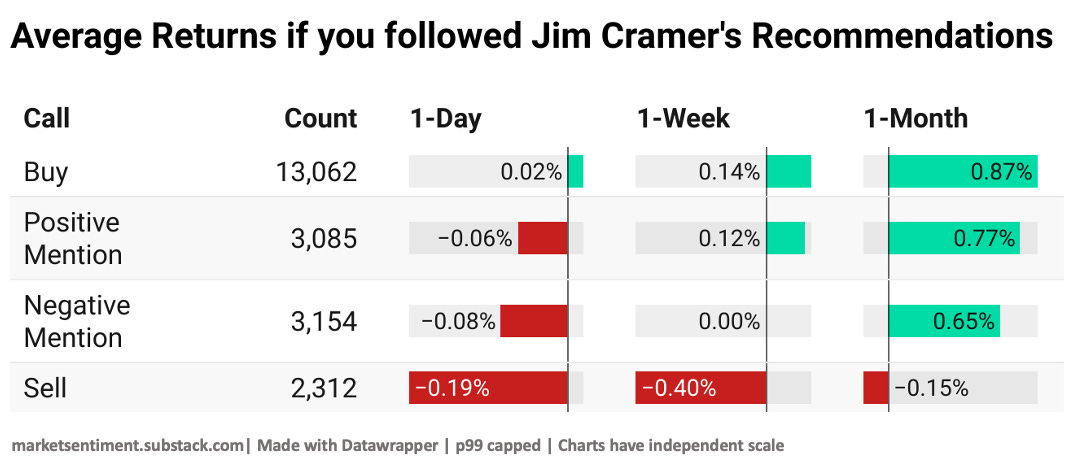
Surprisingly, if you had followed Cramer’s picks to the T, you would not have lost money. On average his buy recommendations went up by 0.87% after a month and his sell recommendations went down by 0.15%. One possible explanation for the brief outperformance is that Cramer’s Mad Money has more than 200K viewers – even if 1% decide to act on his stock tip, it’s big enough to move small stocks. This phenomenon is well-studied and is known as the Cramer Bounce.
In January 2009, graduate students from the University of Pennsylvania published a study claiming that over time, the average next-day increase for a stock that Cramer recommended was 3% for the entire study sample, and almost 7% for smaller cap stocks.They proved through the use of electronic communication networks (ECN) that most trades came in after 7 p.m. ET, when "Mad Money" concluded.
While his standalone performance looks good, it’s a completely different story if you pit him against the market (S&P 500). Except for the 1-day buy recommendations, you would have gotten a better return just investing in the market every single time. Another fascinating insight is that his performance worsens as we increase the time horizon4.
Finally, we all know how easy it is to pick winners in a bull market5 and next to impossible to do the same in a bear market. There was so much money flowing in the system that monkeys and goldfish were beating the market and we were trading images of rocks for actual houses. But, the party came to an end in 2022 with the Fed raising their interest rates at the fastest pace in recent history. So how did Cramer perform in 20226?
All his buy and positive mentions lost money across all time periods! His buy recommendations on average went down 3% in just one month and positive mentions were down 5%. To add salt to the wound, if you had invested in the market instead of Cramer’s calls, you would have scraped by with a ~1% return!
The best & worst calls by Cramer
Even a monkey throwing darts at a chart will be able to pick some successful plays. Cramer has made more than 20K calls and some are bound to work out incredibly well. Here are the top 5 best buy and sell calls made by Cramer. Two of the picks that stand out are the buy rating given to Moderna during the vaccine rally in Jul ’21 and the sell call for the Norwegian Cruise line just before they closed the cruise ships due to Covid. He timed both of them to perfection – We’ve got to give credit where credit is due!
On the other side of the coin, Cramer issued a buy rating to EPR properties & Toll Brothers just before the Covid crash. Both stocks tanked more than 70% in just over a month. During the same time, his worst sell recommendations (Sunrun and Novovax) ended up doubling in just under a month!
His picks were so bad that there are now accounts that track his calls and even an Inverse Cramer ETF that aims to provide investment results by doing the opposite of Cramer’s investment advice.
Heads I win, tails you lose
Show me the incentive and I’ll show you the outcome: Charlie Munger
In the end, we believe that all of us give undue importance to stock-picking influencers – We should all see Cramer for what he is – an entertainer. He does not care about the performance of his stock picks because that’s not how he makes his money. He makes his living by entertaining his audience week after week. His only job is to have a strong opinion – and he does that well.
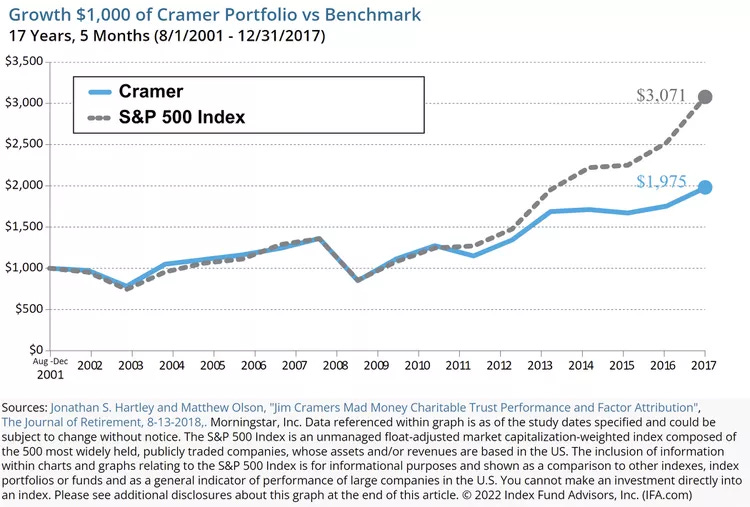
The final nail in the coffin is how Cramer’s own portfolio has performed. He claimed to have a "rate of return of 24% after all fees for 15 years" for his hedge fund until he retired, but his performance was never independently verified. For the portfolio for which the performance was publicly available, researchers at Wharton found that
Both since inception of the portfolio and since the start of “Mad Money” in 2005, Cramer’s portfolio has underperformed the S&P 500 total return index
I guess that just about sums up everything we had to say!
Data used in the analysis: here
Market Sentiment is now fully reader-supported. If you enjoyed this piece, please hit the like button and consider upgrading your subscription. New articles will be limited to paid subscribers starting today.
Footnotes
Data is obtained from the Mad Money website & Quiver Quant. We then adjusted for US stocks that are currently trading.
For those who are interested to know how the returns are calculated
1-day returns are based on the difference between closing and opening price the day after Cramer made his prediction
1-week and 1-month returns are calculated using the adjusted closing price
Returns are capped at the 99th Percentile so that a few outliers don’t skew the trend
Which were once again validated by external studies
This abnormal increase lasts for only about 12 days, whereupon the stock's price retreats back to its pre-recommended price, assuming no other news has been released
2016 to 2021 was predominantly a bull market with only the brief Covid drop in between.
Cramer’s website stopped updating the stock picks after Jul’22. We had to scrape the rest of the data and cannot be certain that we are capturing 100% of his picks. But, the sample size of 1,456 picks that he made in 2022 should be more than enough to give the analysis statistical significance.
Disclaimer: I am not a financial advisor. Please do your own research before investing.


Thanks for the free content over the past years. I have been reading your articles since I encountered them om Reddit and still remember the original one on Kramer. You even inspired me to start my own (very light) fin market research substack.
Good luck with the paid version!
Great article! Shared on Twitter 👍