Crypto DCA
How to consistently make returns from the Crypto market
40,399 coins, 10+ years of data, and 30 million data points.
As far as we know, this right here is the most comprehensive report anyone has ever done on building a DCA strategy for Crypto. We hope you enjoy it — Please share
I have no words. We might have just seen this year's wildest prediction come true. Scottie Pippen, who is in the NBA Hall of Fame, tweeted the following on Sep 4th:
When Scottie made the prediction, Bitcoin was trading at $57K. We are unsure if Scottie was pricing in a Trump win when making his prediction (or if he was thinking at all), but $BTC just had one of its fastest rises in the last 5 years. It blew past Scottie’s prediction (albeit a few days late), and now is trading close to $93K.
While we can all wish Nakamoto to give us stock tips in our dreams, a more realistic strategy would be to Dollar Cost Average (DCA) into crypto.
The good news is that a lot of investors are doing that — According to the report from Kraken:
59% of crypto investors use DCA as their primary investing strategy
83% have used DCA to make their investment
The most common reason for DCA was to hedge against market volatility
The bad news is that, unlike stocks, crypto markets are relatively new, and there is little information about how a DCA strategy performs over the long term. In fact, the market is so nascent that Coinbase launched a crypto benchmark (comparable to, say, the Dow or S&P 500 for the crypto world) just last week.
The Crypto Universe
Here is a wild stat: only ~4,300 publicly traded companies are in the U.S., but more than 15,000 cryptos are actively trading right now.
Of the more than 40,000 coins that traded in an exchange at least once in the last 10 years, only 38% are still alive. So forget about making a profit — the probability that the coin you buy will survive over the long run is only ~ 1 in 3.
What’s fascinating is that Cryptocurrencies follow the exact same power law exhibited by the stock market, where a few winners contribute massively to the overall market. As of Nov’24, the global crypto market cap was ~$2.9 trillion, of which $1.7 trillion (60%) was contributed by Bitcoin.
The top 10 coins contributed to a whopping 89% of the total crypto market. (For comparison, the top 10 companies in the S&P 500 only contribute around 30% of the index)
Bitcoin: DCA vs Lump Sum
The simple fact is that most of us cannot handle the volatility associated with Bitcoin.
Take a look at this fantastic chart put together by my friend at Ecoinometrics (fun fact — He published “Drawdowns are opportunities” at the bottom of 2022 crypto winter. Bitcoin is up 331% to date.)
Holding a crypto portfolio makes the Global Financial Crisis look like a walk in the park. So, it’s natural to consider DCA as a better strategy to invest in crypto.
So, does it work?
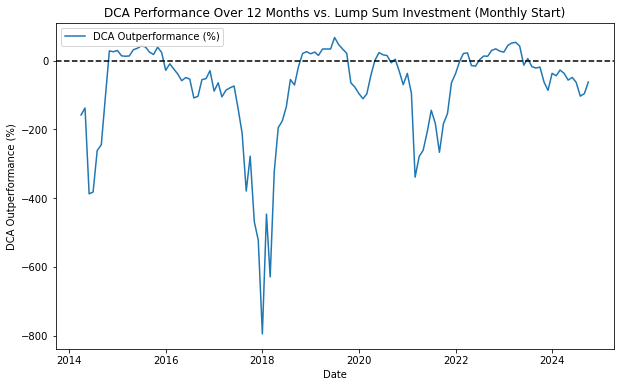
The backtest is simple — Let’s assume that you had $100 to invest in Bitcoin every month. Either we can invest $100 every month or put $1,200 at the beginning of the year1.
Here’s how your portfolio would have performed by the end of the year:
If you invested a lump sum into Bitcoin instead of DCA, you would have come out on top ~66% of the time. Since Bitcoin has extreme volatility, DCA outperforms only during drawdowns.
Case in point — 2018 & 2022. In both bear markets, someone who did DCA would have had a much lower drawdown than someone who invested a lump sum at the beginning of the year.
On the other hand, the same safety mechanism that helps you during bear markets will cost you during bull runs. In the 2017 Bitcoin run-up, the lump sum strategy outperformed DCA by an incredible 700%!

So, if you have a relatively long holding period (at least 12 months), investing in one go is statistically better than splitting it across the year (Given you can stomach the volatility).
Building a Crypto Index
While Bitcoin is synonymous with Crypto, investing in only Bitcoin seems reckless and entirely against the whole “have a diversified portfolio concept”. So, what if instead of just investing in Bitcoin, we split our investments across the top 10 Cryptocurrencies based on market cap?
Before we jump into the results, here is a visualization of how the Crypto market has changed over the years (I have removed stablecoins).
In this backtest, instead of investing $100 per month into Bitcoin, we equally split our investment into the $10 across the top 10 Cryptocurrencies (as seen above in the video) based on their market cap.
The results are stunning:
$100 invested monthly into the top-10 cryptocurrencies starting in 2014 would have grown to $650K+ by 2018 and an incredible $1.6M+ by 2021.
The top-10 portfolio had a CAGR of 111% (yeah, not a typo) over the last 10 years - And irrespective of the year you started, you beat S&P 500!
Even with all this, the Bitcoin-only portfolio gave a better risk adjusted return.
Let’s dig in:


