(Hello friends! Welcome to Market Sentiment. We have blasted past 15K subs last week 🥳.! Join 15,333 other smart investors and traders by subscribing here:
If you are new here, you can check out my best articles here and follow me on Twitter too!
“Stock prices can go to zero. Commodities cannot. Unlike shares in a company, commodities are real things that are always likely to be worth something to somebody.” - Jim Rogers
While Rogers might have missed anticipating Oil prices turning negative in 2020 during the Covid crisis (Something none of us could have predicted), I agree with the sentiment. Even the biggest companies can go bankrupt overnight, but it’s very hard for a commodity with an actual use to drop down to zero.
Given that inflation is running rampant at 8.5%, S&P 500 is down 13% and QQQ is down 22% from their respective all-time highs, I feel now would be the right time to dive into the world of commodities. After all, they are said to have a negative correlation with the equity market and also act as a very good hedge against inflation.
So in this issue, let’s deep-dive into what commodities are, how they have performed in periods of turbulence, and finally if it’s important to have portfolio exposure to them!
What are commodities?
Commodities are simply things that are used as inputs in the production of other goods and services. There is little differentiation between commodities from one producer to that of another - A typical example would be a barrel of Oil. Regardless of the company that produces it, a barrel of oil has equal price and importance in the commodities market.
Commodities can be classified into 4 main types:
Energy - Natural Gas, Crude oil, and its refined outputs such as Gasoline, Diesel, Aviation fuel, etc.
Precious Metals - Gold, Silver, Platinum, Palladium, etc.
Agriculture - Grains, livestock, and softs (Cocoa, Orange juice, etc.)
Industrial Metals - Copper, Aluminum, Zinc, and Tin
Investing in Commodities
The single most important thing to understand in commodities is the principle of supply and demand which is the only basis for pricing. The price of the commodity is not impacted by factors such as manufacturer or type. For example, the price of an iPhone is vastly higher just because it’s built by Apple - this is not applicable in the commodities world where the price of a product just comes down to the market demand.
While there are multiple ways of investing in commodities such as buying individual stocks in companies that produce commodities, futures contracts, pool operators, etc., we will be focusing only on ETFs and Mutual funds in the space, as they are relatively less risky and also are much easier to get portfolio exposure to.
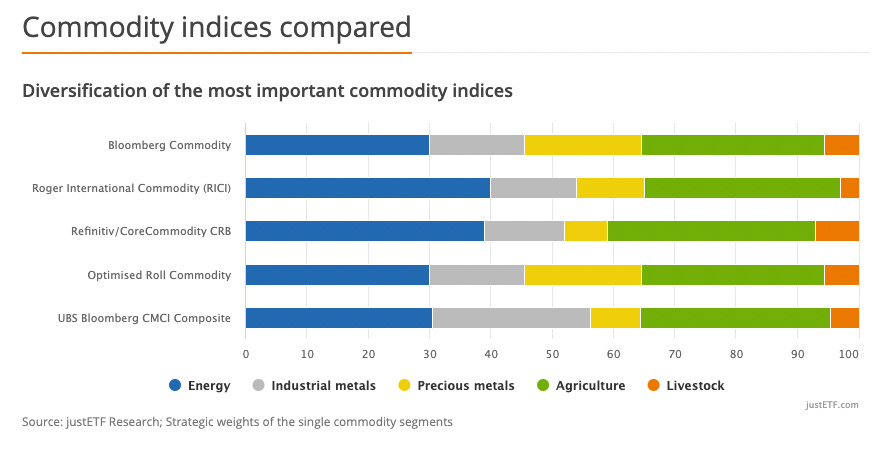
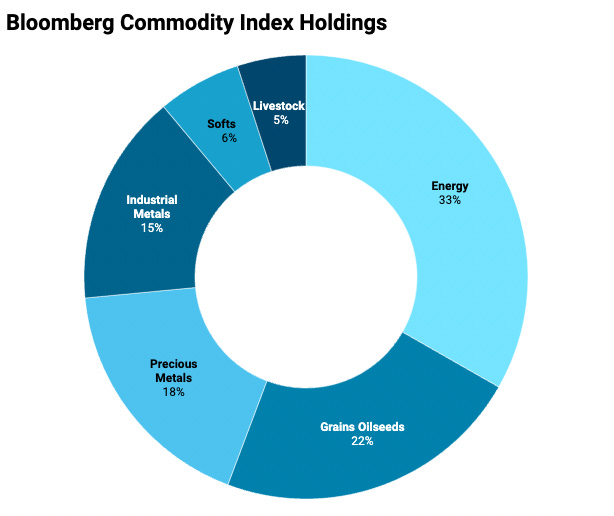
As you can see, there are multiple indices that track various amounts of allocation to different types of commodities. Ideally, you should be investing in a broad exposure commodity ETF as commodities, in general, are much more volatile than stock prices, and having too much exposure to just a single one might expose your portfolio to significant downside risks.
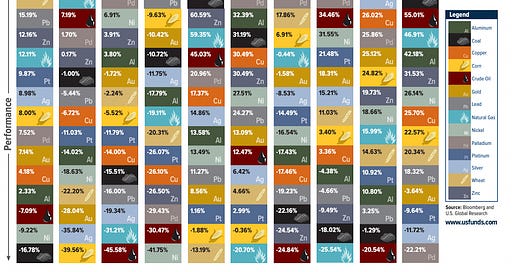
But if you are willing to take that risk, commodities are some of the most volatile and high return assets. This chart from VisualCapitalist shows us how much fluctuation is experienced every year in the commodity market.
Historical performance
Before we jump into the historical performance, I want to highlight how Commodities have a negative correlation with equities and also act as a hedge against inflation. We will be comparing the performance of the Bloomberg Commodity Index vs the S&P 500.
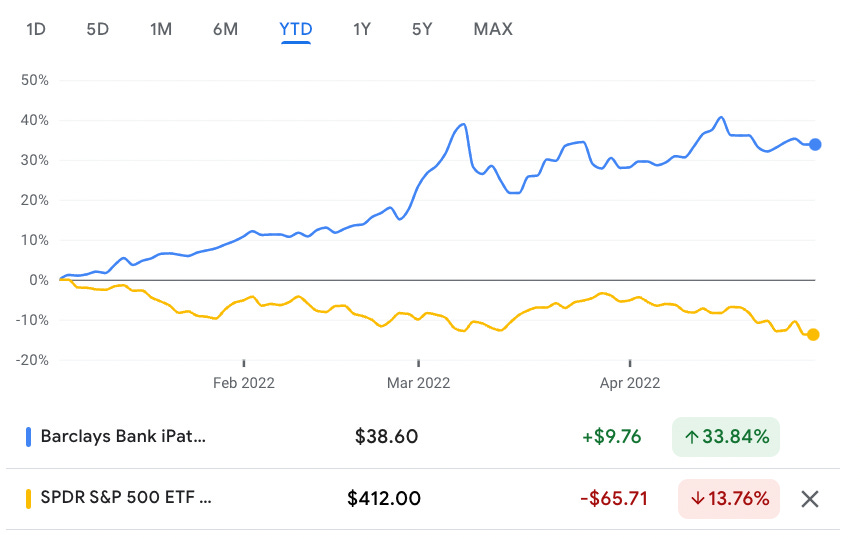
Bloomberg commodity index is a well-diversified portfolio containing a mix of energy, agriculture, livestock, and precious as well as industrial metals. The S&P 500 is also a diversified index containing Information Technology, financial services, energy, etc. but on the equity market side. Let’s compare how both have performed since Jan 1st, 2022, a time period when inflation worries were rampant and equities were undergoing a correction.
As expected, the commodity market has outperformed the equity market. While the S&P 500 was down ~14%, the commodity index was up 34%! This is one of the key benefits of investing in commodities. But this inverse relationship is not always perfect. If the overall economic growth also falls sharply, the commodities also fall as the demand for oil, copper, corn, etc slows as well, as we saw during the 2008 crash.
Before you go all-in on commodities, it’s important to understand that their performance over the past decade has been abysmal.
Since its inception in 2006, the Bloomberg commodity index had a cumulative return of -21% when compared to the 350% returned by S&P500. This is because most of the underlying assets such as Crude Oil, Copper, and Gold have barely managed to beat their all-time highs in 2008. Imagine waiting 15+ years only for your portfolio to be down 20%!
But it’s slightly unfair to compare a time period where the stock market had done exceptionally well and commodities had done extremely poorly. Washington Trust Bank had done an interesting analysis that compared the returns over the past 5 decades.
It’s just in the past decade or so that Commodities have given such abysmal returns. If you consider the 2000-2010 period, commodities actually beat the S&P 500. Overall, S&P 500 gave a better-annualized return. But remember our initial argument that commodities perform in a high inflation environment - Does that hold over longer time periods?
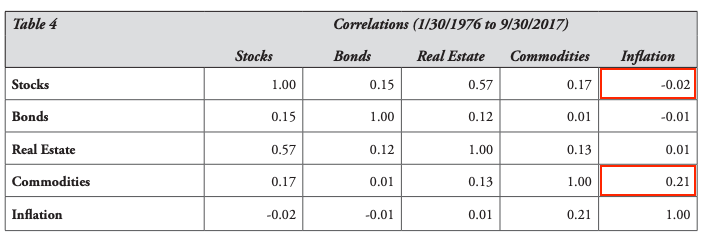
As expected, commodity prices are positively correlated with inflation whereas Stocks have a slightly negative correlation with inflation. What this means is that having commodities in your portfolio helps you overcome the inflation shocks in the stock market.
How much should you allocate to Commodities?
Now that we have conclusive evidence that having commodities in our portfolio can help minimize downside risks, the question becomes how much to allocate to commodities? Also, the holy grail of investing is having better risk-adjusted returns - Even though we know that the S&P 500 gives a better return than commodities, does adding commodities to our portfolio help us achieve better risk-adjusted returns?
Risk-adjusted returns for a diversifed stocks and commodities portfolio outperformed over the entire period of study (1/31/1970 to 9/30/2017) when compared to commodities or stocks alone - Washington Trust Bank Research
Sharpe ratio is a measure of risk-adjusted return and indicates the amount of excess return that can be obtained for a given level of risk. Over the last 5 decades, 3 gave better risk-adjusted returns for stocks and 2 gave better returns for Commodities. But overall the stocks and commodities optimized portfolio achieved the best risk-adjusted returns of all of them. It achieved this by having 72.5% exposure to S&P 500 and 27.5% exposure to the Commodities Index.
Even though commodities had a rough run over the past few years, if you look long term, having exposure to them definitely benefits your portfolio. While nobody has a crystal ball and can predict accurately what’s going to happen in the markets, I believe the current trend of high inflation, supply chain constraints, and turbulence in the Oil market due to the Russia-Ukraine conflict are all going to push the commodity index even higher.
Until next week...
More Interesting Reads
Abundantia - Abundantia does a fantastic job of connecting the dots between what happened in the past and what’s happening currently in the financial world. While I think the authors are a bit too pessimistic, I really do enjoy their take on Carbon Credits. Imagine a world where all your actions and decisions are based on how much carbon it would consume?
If you enjoyed this piece, please do us the huge favor of simply liking and sharing it with one other person who you think would enjoy this article! Thank you.
Disclaimer: I am not a financial advisor. Do not consider this as financial advice.








Very good piece, again. This has been an area I’ve been focused on a more macro scale, but this was excellent.
I never get tired of reading your pieces. Although I spend a lot of time viewing charts and studying financial history, nothing else gives me a better return on my "time investment" than your pieces. I appreciate you