

Best Performing Markets
Evaluating the stock market performance across the world

We have no paywall on this report.
If you are new here, join 42,000+ investors by subscribing below:
Legend has it that in 1626, the native Lenape people sold the island of Manhattan to Peter Minuit of the Dutch East India Company for 60 guilders worth of trinkets, which were worth only $24. Considering that Manhattan is now worth more than $1.7 trillion1, the whole trade seems like a lousy deal for the natives.
But Buffett tells this story differently2
To the novice, perhaps this sounds like a decent deal.
However, the Indians have only had to achieve a 6.5% return (The tribal mutual fund representative would have promised them this) to obtain the last laugh on Minuit.
As always, Buffett was right on the money. If the $24 were invested in an imaginary S&P 500 index starting in 1626, by 2025, it would be worth $8.2 Trillion3 — enough to buy the entire island of Manhattan 3 times over!
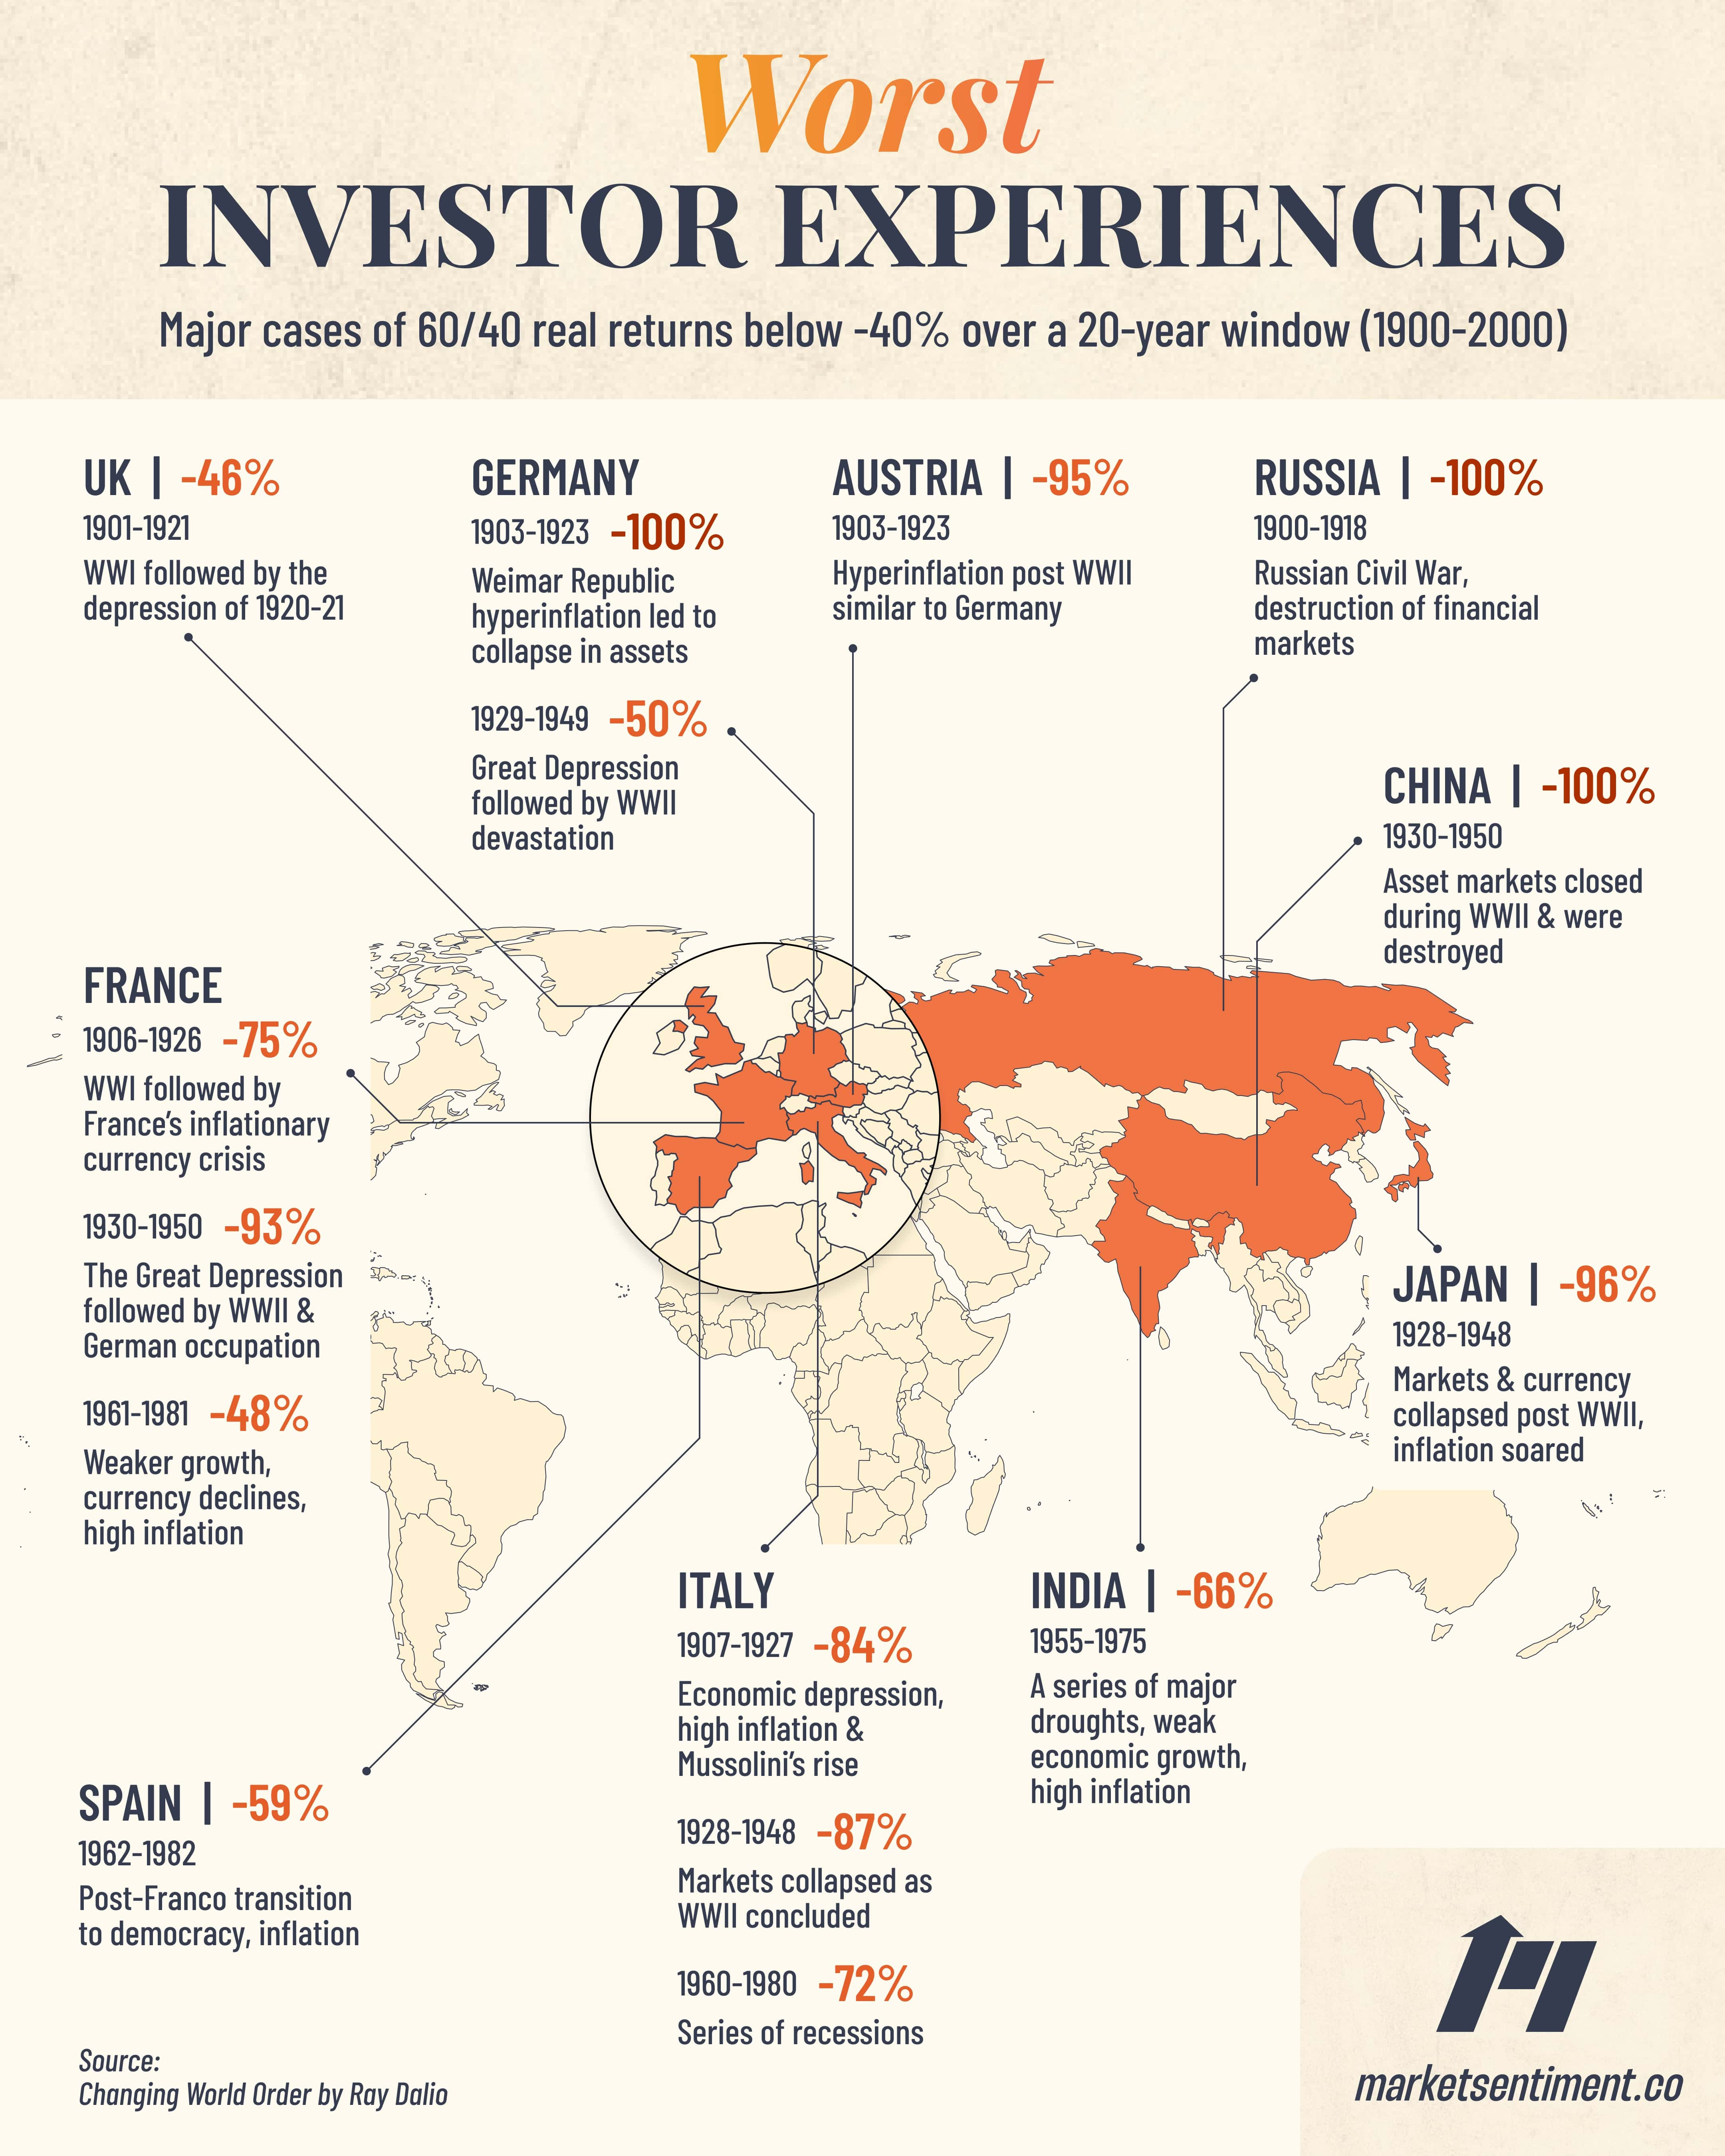
While Buffett’s tale underscores the power of compounding4, it also assumes a best-case scenario. The U.S. is literally the only market that has performed so well for so long without any black swan events. History shows us that the same story would have never worked in another developed market like Germany, Austria, or France — any of which could have arguably become a great, wealthy empire rivaling the U.S.
Germany's market was wiped out during World War 1 and again during World War 2.
Austria had a -95% drawdown due to hyperinflation.
France, Japan, Russia, and China all had their wealth virtually wiped out once.
The U.S. Supremacy
It’s hard to put into context how much the U.S. market has outperformed during the past century.
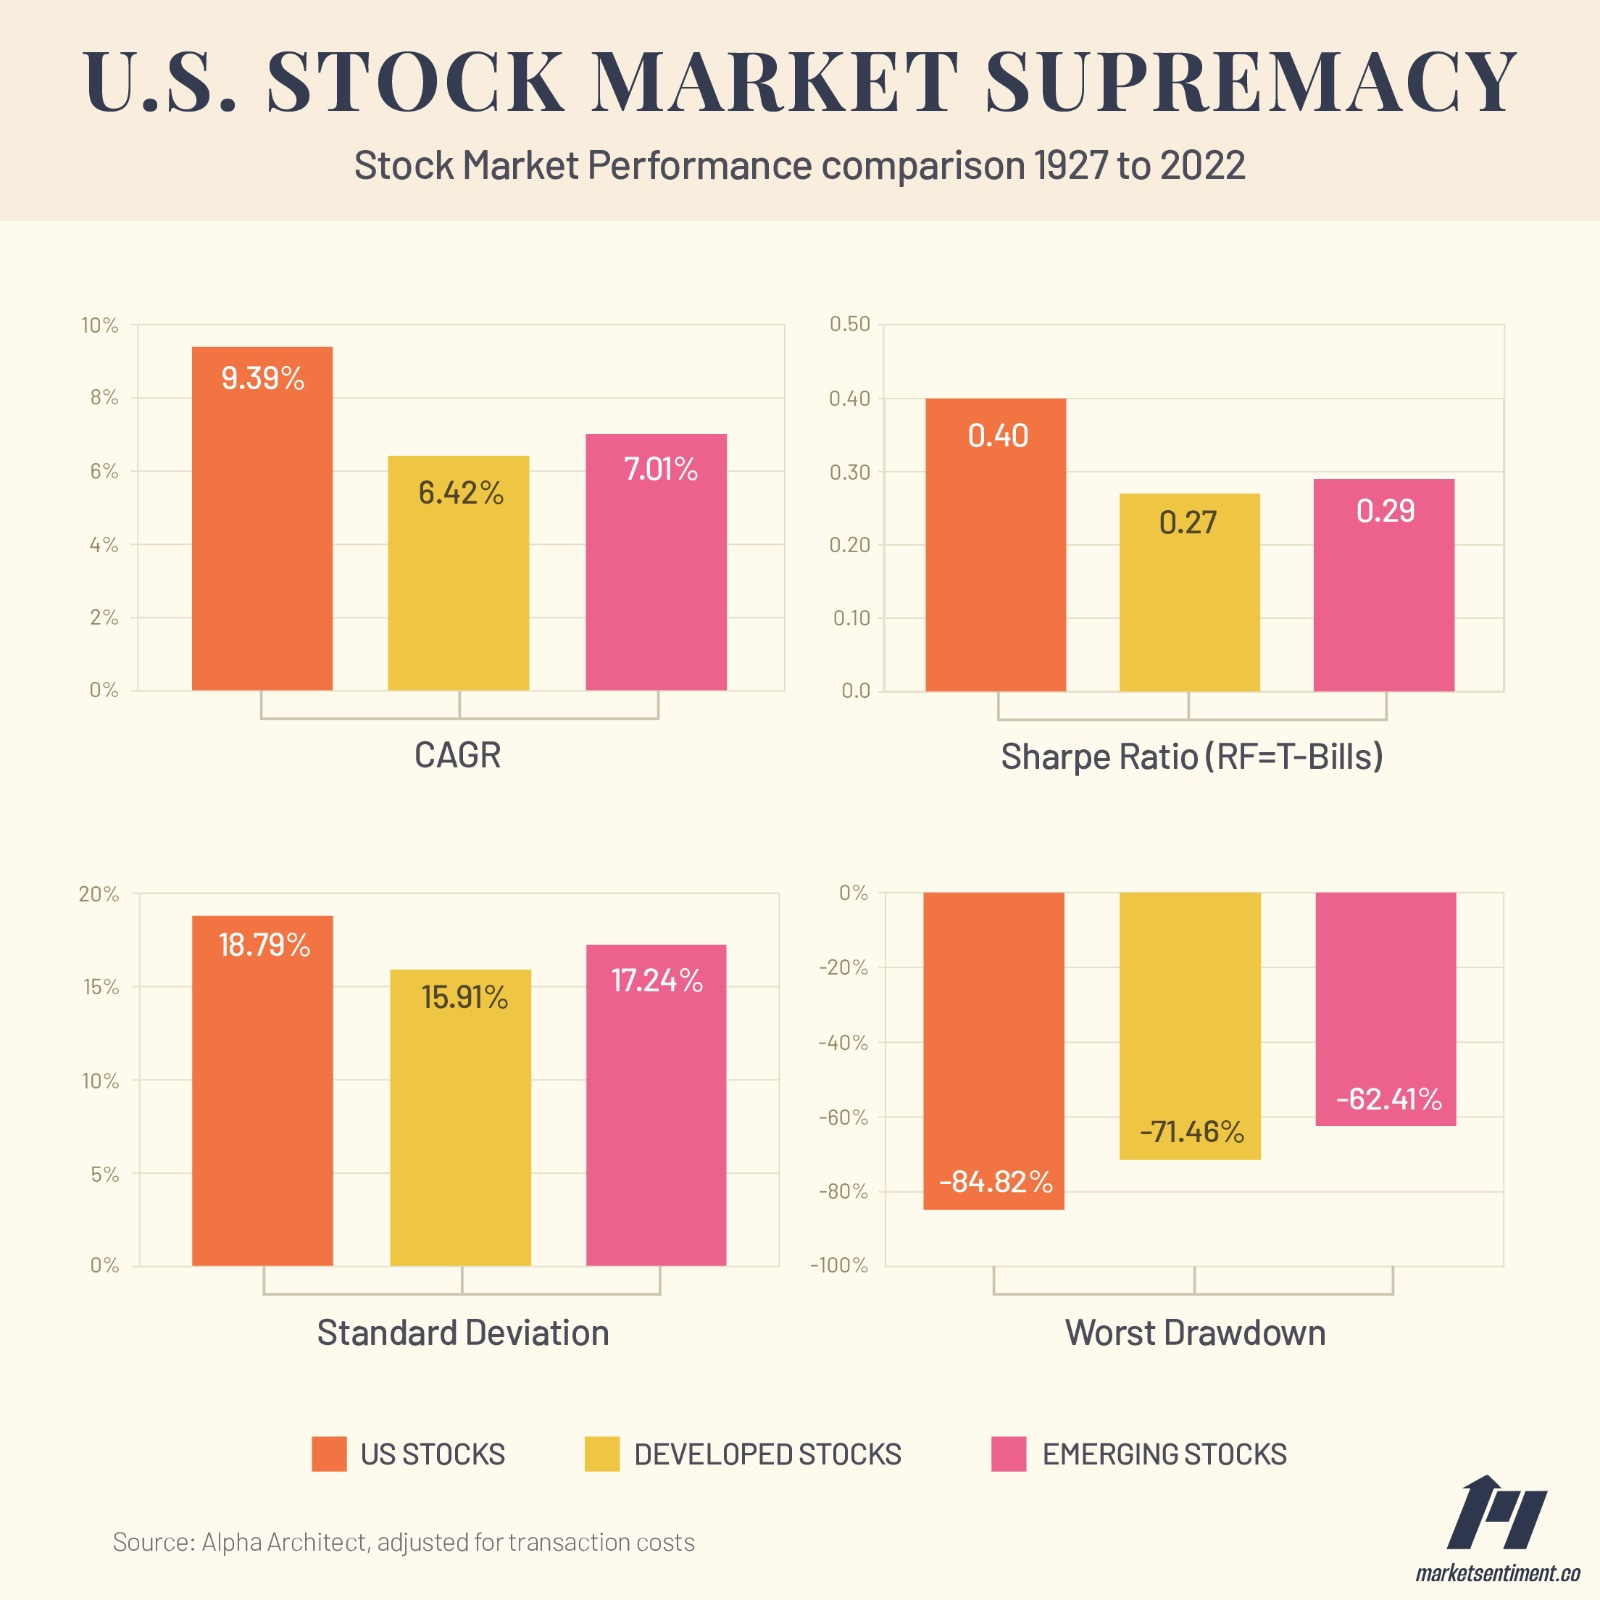
According to the calculations from Alpha Architect, the U.S. stock market had a CAGR of 9.39% from 1927 to 2022 (almost 100 years) — ~50% more than other developed markets and ~30% more than emerging markets. Even though the U.S. market had slightly higher volatility and worse drawdowns, it came out on top for risk-adjusted performance.
For a generation of investors, relying solely on the U.S. market has been a winning experience. However, relying entirely on past returns can lead to misguided expectations about the future.
Even Buffett, who has been nudging investors to invest in the S&P 500 since the 1980s, understands the importance of international diversification and has bet big on Japan.
There are also many other countries around the world that have bright futures. About that, we should rejoice: Americans will be both more prosperous and safer if all nations thrive. At Berkshire, we hope to invest significant sums across borders.
Emerging and Developed Markets Performance
Even during the current period of U.S. dominance, there might have been pockets of outperformance in global markets. To test this, we evaluated the performance of some of the top developed and emerging markets worldwide.
To shortlist the countries, we leveraged the top-10 holdings of the Vanguard FTSE All-World ex-US ETF5. It’s a good mix of developed and developing markets, and even in the case of developing markets, it’s reasonably accessible to investors in the U.S.

5 & 10 Year Performance
The U.S. has outperformed all other countries over the five and ten-year time horizons. Two factors primarily drove this strong performance.
The first was the extraordinary rise of tech companies in the S&P 500. If you look at 2010, only 4 of the top 10 companies in the S&P 500 were tech. Fast forward to 2025; the only companies that are not tech in the top 10 are Berkshire Hathaway and Eli Lilly.
The second key driver was the strong U.S. Dollar performance, a topic we will cover next.
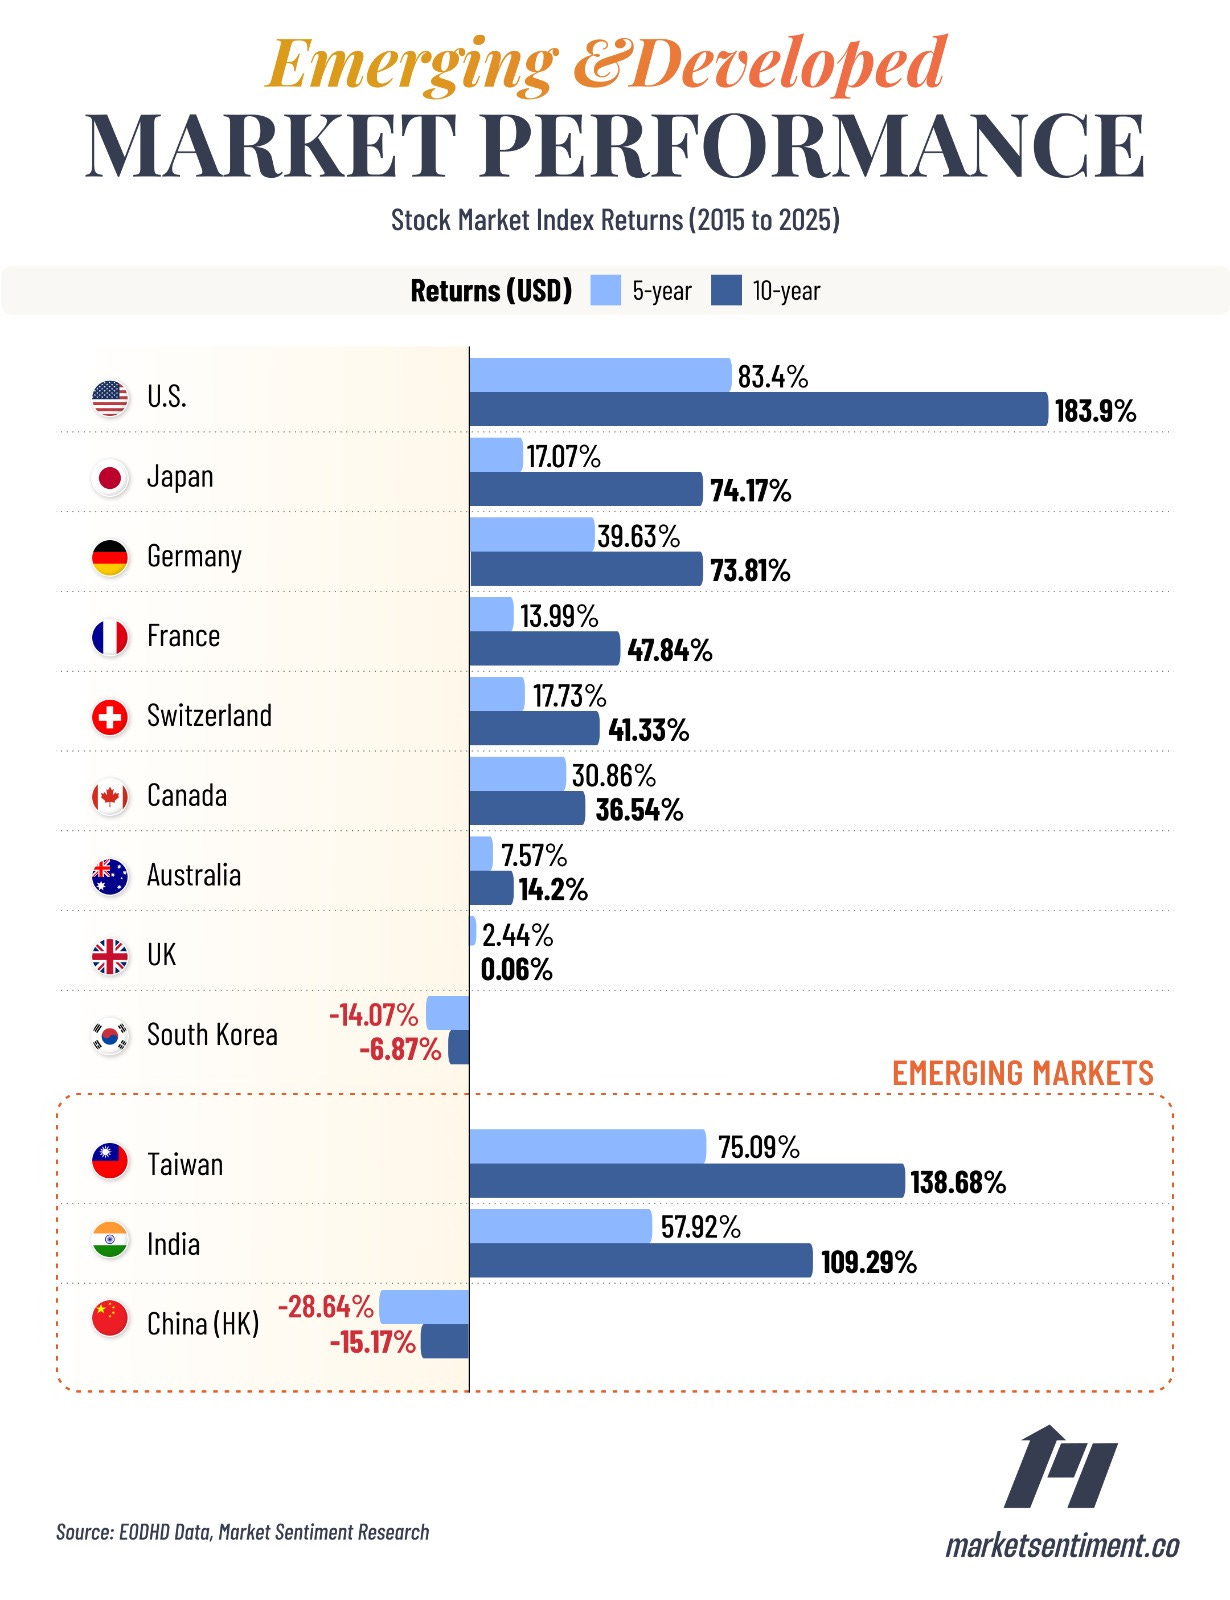
The U.S. also stands out as the only developed country that would have doubled your investment return in the last 10 years (183.9%). Compared to this, among emerging markets, both India and Taiwan had 100%+ returns, even after adjusting for currency depreciation. Finally, the U.K., Hong Kong, and South Korean markets serve as a reminder of the risks of long-term equity underperformance.
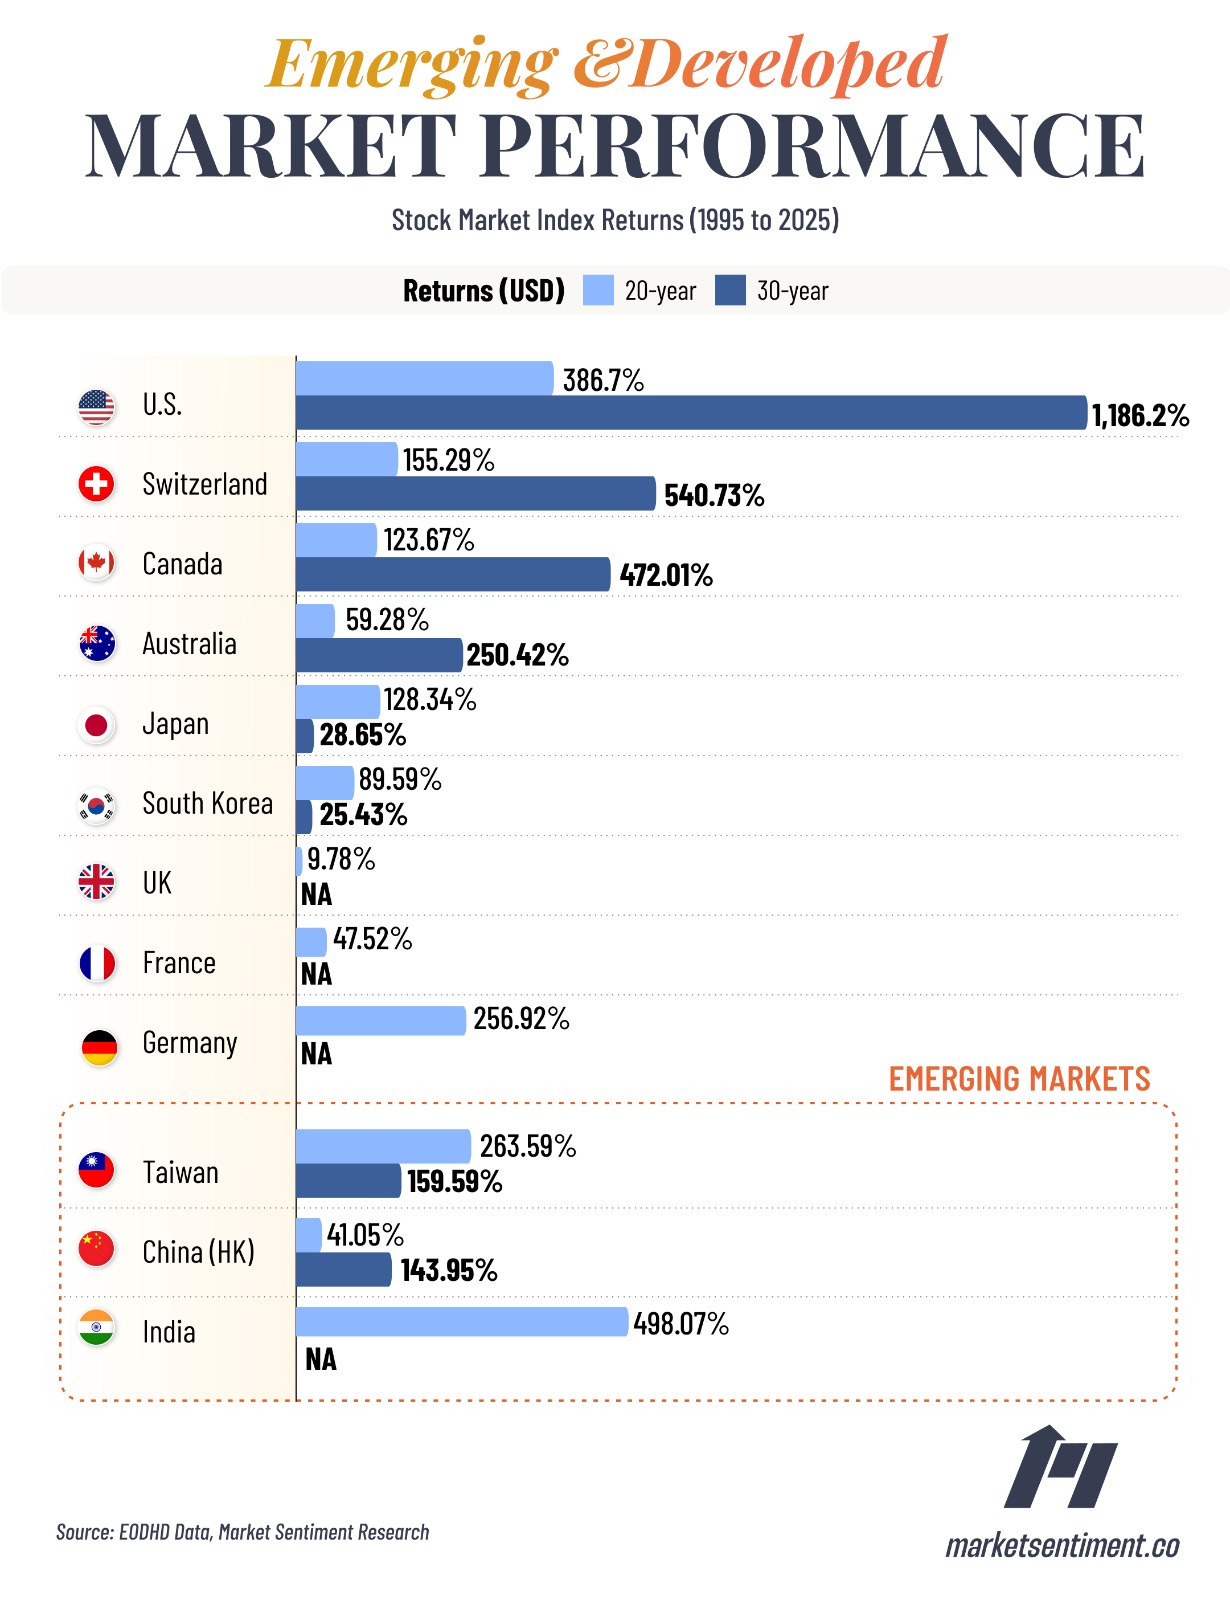
20 & 30 Year Performance
Expanding the investment time horizon reveals some interesting insights.
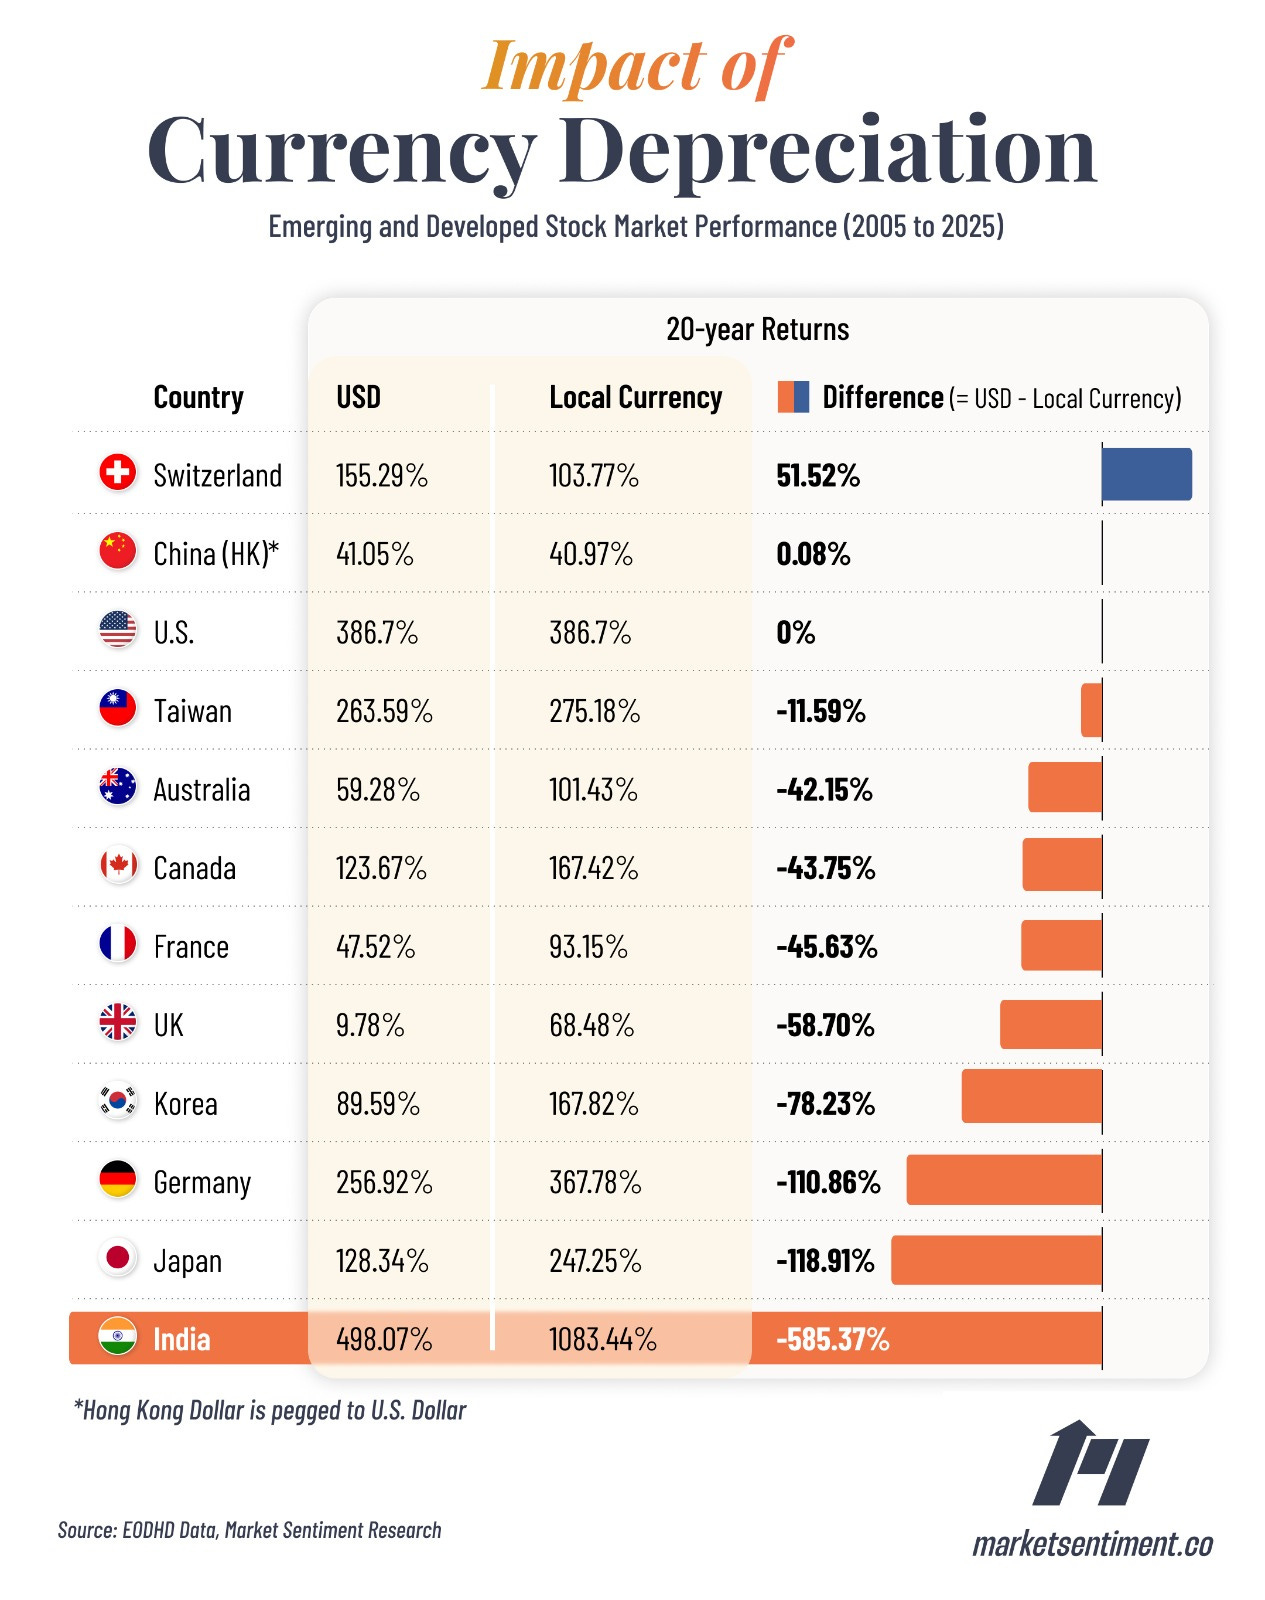
After adjusting for currency depreciation, the only market that outperformed the U.S. market (386%) in the last 20 years was the Indian market (498%).
The 28% return of the Japanese market over the past 30 years captures the “lost decades” post-1990 bubble.
While they have not outperformed the U.S. markets, both Germany and Taiwan have given excellent returns (20 years) that might be uncorrelated to the U.S. markets. You must remember that it’s vital as an investor to own assets that are uncorrelated.
USD Supremacy: Local vs. Adjusted returns
Here’s an interesting question: Take a look at the interest rate of the Indian Market (comparable to the Fed rate in the U.S.). In 2011, while the U.S. offered a whopping 0.25%, the Indian Markets offered 8.5%. In simple terms, if you had put your money in a money market account in the U.S., you would’ve got a 0.25% return per year, and in India, you would’ve got 8.5% per year6.
In other words, it will take only ~8 years to double your money in an Indian account compared to ~288 years in a U.S. account. So why shouldn’t an investor just keep their funds in India instead of the U.S.?
The answer lies in currency and country risk.
In 2005, 1 USD was equal to 44 Indian Rupees. Fast forward 20 years, now 1 USD is worth 86 Indian Rupees. So, the Indian Currency has roughly lost half its value (49%) when compared to the US Dollar.
So, even if you gain some additional interest rate by parking your fund in an emerging market, if that currency depreciates against the US dollar, your net gain will shrink dramatically. Plus, you now also have to deal with country risk.
This currency depreciation has had a significant impact on international investors:
At first glance, the German Market (367%) offers comparable returns to the U.S. Market (386%). However, the Euro has depreciated more than 20% over the last two decades. So, for a U.S. investor investing in the German markets, the effective return would only be 257%!
To see a more extreme example, let’s go back to India. Locally, the Indian stock market has ~10’xed (1083%) in 20 years. But, if you are a U.S. investor investing in the Indian stock market, your net return would only have been 498%.
On the other end of the spectrum, the Swiss franc appreciated against the U.S. Dollar due to its safe haven status and Switzerland’s extremely low inflation rates.
Nobel Prize-winning economist Harry Markowitz, the father of Modern Portfolio Theory, famously called diversification “the only ‘free lunch’ in finance.” Even though the U.S. has been outperforming over the past few decades, you don’t have to go too far back to see a vastly different picture.
The 2000s were pretty much a lost decade for the U.S. market — during the ten-year period from 12/31/1999 through 12/31/2009, the S&P 500 only generated an annualized return of -0.9%. During this decade, international developed markets returned a CAGR of 3.5%, and emerging markets returned an incredible 15.9%!
Ultimately, putting all your eggs in one basket has rarely worked out for anyone in the long run.
Data
Emerging and Developed Market local and currency-adjusted returns — here
List of low-cost ETFs
Country | ETF | Expense Ratio | AUM
Japan | JPMorgan BetaBuilders Japan ETF | 0.19% | $11B
Canada | Franklin FTSE Canada ETF | 0.1% | $0.4B
Switzerland | iShares MSCI Switzerland ETF | 0.5% | $1B
UK |iShares MSCI United Kingdom ETF | 0.5% | $3B
France | iShares MSCI France ETF | 0.5% | $0.7B
Germany | iShares MSCI Germany ETF | 0.5% | $1B
Australia | iShares MSCI Germany ETF | 0.5% | $1.5B
China (Hong Kong) | iShares MSCI Hong Kong ETF (EWH) | 0.5% | $0.6B
India | iShares MSCI India ETF (INDA) | 0.62% | $9B
Franklin Templeton usually has a lower-cost ETF (<0.2%) for all the above countries, but the AUM is <$50 million.
You just finished a 1,600-word deep dive
If you made it this far, chances are you gained at least a few insights that will help you make a smarter investor. If you would like to receive reports like this frequently and get access to our full research, consider becoming a paid subscriber! Thank you :)
Footnotes
For what it’s worth, the entire story is marred with controversy, and there is no one generally accepted value.
Derived from his 1965 shareholder letter
The sixth edition of Stocks for the Long Run calculates the long-term real returns at 6.9%. So, the value in 2024 = $24 x (1.069)^398
Another interesting observation is that there were 10,000 millionaires in the U.S. in 1918. If you invested $1M in the U.S. Market index and held it till now, it would be worth $1B+. Yet, we still don't know a single person or family that has achieved this.
A lot of nuances here
a > Obviously, there is hindsight bias here. These countries performed well due to which they are in the top 10
b > It’s hard to get reliable stock market data for all countries going back 20+ years
c> Finally, even if we find that say, Kenya has had the best-performing stock market over the past 10 years, it’s unrealistic to get easy access to their markets sitting in the U.S.
Approximately, of course!
1) Hedged ETFs to handle FX risk
Market Sentiment gives a list of country-specific ETFs, but none of them handle the currency depreciation risk, which can be very significant. For example, the Japanese yen has depreciated 29% against the US dollar in the past 5 years.
Here are a list of country or region-specific currency-hedged ETFs to handle this risk:
Country/Region | ETF (Ticker) | Expense Ratio | AUM
Japan | WisdomTree Japan Hedged Equity Fund (DXJ) | 0.48% | $3.9B
Europe | WisdomTree Europe Hedged Equity Fund (HEDJ) | 0.58% | $1.5B
EAFE | iShares Currency Hedged MSCI EAFE ETF (HEFA) | 0.35% | $5.5B
2) Countries whose stock markets have collapsed in the past: Germany, Austria, France, Japan, Russia, China
One way to avoid this risk is to diversify globally, but the other, less used, and perhaps more effective way is to short the market at the right time. https://blog.inverteum.com/p/professional-investment-strategies-need-short-component