2035
American Exceptionalism Vs. Market Realities
What we learn from history is that people don’t learn from history. — Georg Hegel
Buffett’s biography, The Snowball, starts off with the famous speech he gave at the Sun Valley Conference in 1999. The logic during that time was simple: America’s tech future was limitless. The internet was changing everything, and the traditional rules of valuations were no longer applicable. The Sun Valley Conference that year was full of technology gurus who were changing the world and had their companies trading at extravagant valuations. Sermonizing on the stock market’s excesses at Sun Valley in 1999 was like preaching chastity in a house of ill repute.1
Yet, Buffett stuck to his guns. His point was that the investors who bought internet stocks were not in for a great time.
A Paine Webber and Gallup Organization survey released in July shows that the least experienced investors—those who have invested for less than five years—expect annual returns over the next ten years of 22.6%. Even those who have invested for more than 20 years are expecting 12.9%.
So I come back to my postulation of 5% growth in GDP and remind you that it is a limiting factor in the returns you're going to get: You cannot expect to forever realize a 12% annual increase — much less 22% — in the valuation of American business if its profitability is growing only at 5%.
The inescapable fact is that the value of an asset, whatever its character, cannot over the long term grow faster than its earnings do. — Buffett on the Stock Market (Nov, 1999)
We find ourselves at a similar crossroads now. Biased by the exceptional performance of the last decade, U.S. investors are expecting a whopping 13% long-term return on their investments. To put this in perspective, the best-ever earnings growth for U.S. stocks during a non-recessionary time was 6%.

Next decade for U.S. equities
U.S. Economist John Kenneth once famously said that The only function of economic forecasting is to make astrology look respectable. Still, inspired by AQR’s predictions for 2035, we can make directional bets on how the market will behave over the next decade.
There are four worrying trends that all point to an over-valued market:
1. Shiller PE Ratio is more than 2x long-run average
The CAPE ratio (aka Shiller PE Ratio) is calculated by dividing the current price of the S&P 500 by the average inflation-adjusted earnings over the past 10 years. A high CAPE ratio indicates that stocks are expensive relative to historical earnings, suggesting that future returns may be lower.
Currently, the CAPE ratio is approximately 38, which is more than double the 20th-century average of around 15. To put this into perspective, if the CAPE ratio were to revert to the 25-year average of 27, it would imply a painful 30% decline in stock prices, assuming no change in earnings.
2. U.S. Equity Premium is now negative
Simply put, the equity risk premium measures how much extra return you will get investing in a risky asset compared to a risk-free asset like treasury bills. The rationale is that investors are risk-averse, and they need a higher return to justify investing in a risky asset like stocks.
The equity risk premium for the S&P 500 has fallen to its lowest level in 23 years. The last time it was this low was just before the dot-com bubble peak.
3. U.S. Performance was mainly driven by Multiple Expansion
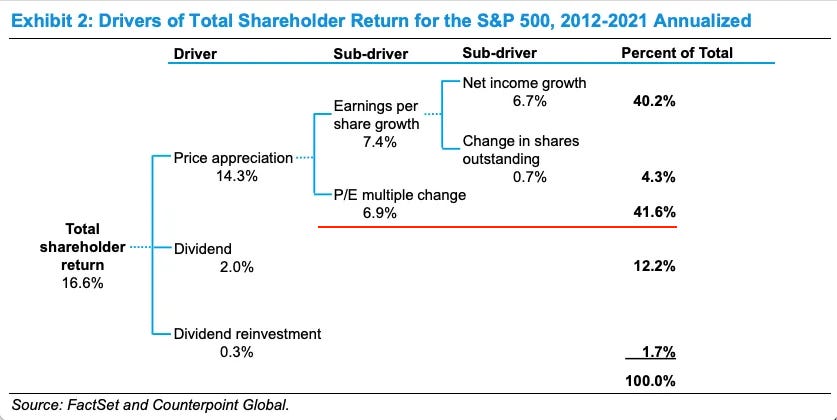
Michael Mauboussin broke down the various drivers of total shareholder return for the S&P 500 from 2012 to 2021.
Total Shareholder Return=Dividend Yield+Earnings Growth+Multiple Expansion
A concerning trend that we can immediately recognize is that P/E multiple expansion (i.e., the stock price rising faster than the underlying earnings) drove a significant proportion (41.6%) of the returns.
AQR had similar findings — The U.S. outperformance in the past few decades was mainly driven by valuation changes rather than fundamental improvements in the economy [emphasis ours]
Since 1990, the vast majority of the US’s outperformance versus the MSCI EAFE Index (currency hedged) of a whopping +4.6% per year, was due to changes in valuations.
The culprit: In 1990, US equity valuations (using Shiller CAPE) were about half that of EAFE; at the end of 2022, they were 1.5 times EAFE. Once you control for this tripling of relative valuations, the 4.6% return advantage falls to a statistically insignificant 1.2%.
In other words, the US victory over EAFE for the last three decades—for most investors’ entire professional careers—came overwhelmingly from the US market simply getting more expensive than EAFE. — AQR Research
As value investing teaches us, winning simply because the other person is willing to pay more is not a sustainable strategy.
4. Rising stock market concentration
The top 10 stocks now contribute to an incredible 1/3rd of the total weight of the S&P 500. Out of this, Nvidia alone contributed 22% of the gains of the S&P 500 for 2024, and if you add Apple, Amazon, and Meta, this pushes to 40%. While market-cap-weighted indexes are designed to capture outlier performance by a few companies, betting that the trend will continue is wishful thinking.
Going back to what happened after the dot-com bubble, not even 1 out of the top 10 largest market-cap tech stocks beat the S&P 500 over the next 18 years.
At the beginning of 2000, the 10 largest market-cap tech stocks in the United States, collectively representing a 25% share of the S&P 500 Index—Microsoft, Cisco, Intel, IBM, AOL, Oracle, Dell, Sun, Qualcomm, and HP—did not live up to the excessively optimistic expectations.
Over the next 18 years, not a single one beat the market: five produced positive returns, averaging 3.2% a year compounded, far lower than the market return, and two failed outright. Of the five that produced negative returns, the average outcome was a loss of 7.2% a year, or 12.6% a year less than the S&P 500. — Research Affiliates.
Going even further back, based on the last 95 years of data, the biggest stocks had an average annualized return of 20% in excess of the market 5 years before joining the top 10 list.
However, once they joined, they underperformed the market by 0.9% in the next 5 years.
For a repeat performance of the past decade, the valuations have to reach unprecedented levels.
If we assume the historical average earnings growth of 2.5%, to get the same returns as we got in the last decade, the stock valuations have to become so high that they are 40% higher than what it was during the Dot-Com bubble (CAPE has to increase from its current value of 37 to 61!).
Even if we give the most optimistic assumption of earnings growth of 6% (the best ever outcome for U.S. stocks during a non-recessionary time!), the Shiller PE ratio has to cross the ‘99 bubble level for stocks to return to what they did in the last decade.
To forecast a repeat performance from equity markets, you must forecast earnings growth at levels unprecedented in a non-recession economy and the market to trade at its richest level ever at the end of the decade.
While it’s impossible to rule out this scenario, it is an implausible baseline assumption. — Jordan Brooks, Principal at AQR Research
Further reading:
In investing, doing the right things is usually hard.

Here's why you should consider international diversification.The first time they met, Warren Buffett introduced Bill Gates to his favorite critical thinking exercise
Buffett uses it to spot long-term trends and investments.
Let's recreate his exercise using data from the last 4 decades:If you have made it this far, chances are you have gained at least a few insights that will help you become a smarter investor. If you would like to receive reports like this frequently and get access to our full research, consider becoming a paid subscriber! Thank you :)
Excerpt From The Snowball, Alice Schroeder


